Tability is a cheatcode for goal-driven teams. Set perfect OKRs with AI, stay focused on the work that matters.
What are Reporting Automation OKRs?
The Objective and Key Results (OKR) framework is a simple goal-setting methodology that was introduced at Intel by Andy Grove in the 70s. It became popular after John Doerr introduced it to Google in the 90s, and it's now used by teams of all sizes to set and track ambitious goals at scale.
Formulating strong OKRs can be a complex endeavor, particularly for first-timers. Prioritizing outcomes over projects is crucial when developing your plans.
We've tailored a list of OKRs examples for Reporting Automation to help you. You can look at any of the templates below to get some inspiration for your own goals.
If you want to learn more about the framework, you can read our OKR guide online.
The best tools for writing perfect Reporting Automation OKRs
Here are 2 tools that can help you draft your OKRs in no time.
Tability AI: to generate OKRs based on a prompt
Tability AI allows you to describe your goals in a prompt, and generate a fully editable OKR template in seconds.
- 1. Create a Tability account
- 2. Click on the Generate goals using AI
- 3. Describe your goals in a prompt
- 4. Get your fully editable OKR template
- 5. Publish to start tracking progress and get automated OKR dashboards
Watch the video below to see it in action 👇
Tability Feedback: to improve existing OKRs
You can use Tability's AI feedback to improve your OKRs if you already have existing goals.
- 1. Create your Tability account
- 2. Add your existing OKRs (you can import them from a spreadsheet)
- 3. Click on Generate analysis
- 4. Review the suggestions and decide to accept or dismiss them
- 5. Publish to start tracking progress and get automated OKR dashboards

Tability will scan your OKRs and offer different suggestions to improve them. This can range from a small rewrite of a statement to make it clearer to a complete rewrite of the entire OKR.
Reporting Automation OKRs examples
You'll find below a list of Objectives and Key Results templates for Reporting Automation. We also included strategic projects for each template to make it easier to understand the difference between key results and projects.
Hope you'll find this helpful!
OKRs to implement automation in financial reporting
 ObjectiveImplement automation in financial reporting
 KRProcure and integrate an automation tool by week 8
 Research and select a suitable automation tool by week 4
- Install and test automation tool integration by week 8
- Purchase chosen automation tool in week 5
- KRIdentify and standardize 100% reportable financial data by week 6
- Review all current financial data for standardization
- Implement standardization protocol by week 6
- Establish parameters for 100% reportable data
- KRReduce financial report generation time by 50% by week 12
- Implement automation software for faster report compilation
- Delegate assignments among financial team members
- Improve and streamline data collection processes
OKRs to implement automation in the reporting process
- ObjectiveImplement automation in the reporting process
- KRAchieve 95% accuracy in automated reports and reduce manual effort by 60%
- Implement data quality checks in the reporting process
- Train team on new automated reporting processes
- Automate documentation and validation steps
- KRSuccessfully develop and test automation tool for 75% of identified processes
- Identify key processes suitable for automation
- Validate tool through comprehensive testing
- Develop automation tool for chosen processes
- KRIdentify and map 100% of the current manual reporting processes by end of first month
- Inventory all existing manual reporting procedures
- Categorize different manual reporting process types
- Create a comprehensive flowchart of all processes
OKRs to implement automation in analytic reporting process
- ObjectiveImplement automation in analytic reporting process
- KRAchieve 30% reduction in reporting time by final week of the quarter
- Implement automated tools for quicker data processing
- Streamline workflow for more efficient reporting
- Train staff on time management techniques
- KRDefine and document all steps of the current analytic reporting process by week 4
- Identify all steps involved in analytic reporting process
- Complete document outlining process by week 4
- Write a detailed document describing each step
- KRDetermine and integrate suitable automation tool to existing process by week 8
- Research available automation tools that fit the existing process
- Choose a suitable automation tool based on research
- Implement and integrate the chosen tool by week 8
OKRs to enhance precision and pace in state regulatory reporting
- ObjectiveEnhance precision and pace in state regulatory reporting
- KRImplement a new automation process to decrease reporting time by 30%
- Train staff on using the new automation system
- Procure an automation system suitable for our needs
- Identify current reporting processes that can be automated
- KRReduce regulatory reporting errors by 15% via enhanced employee training
- Establish quality checks to identify and fix reporting errors promptly
- Implement regular training sessions for all reporting staff
- Develop comprehensive training program focused on regulatory reporting procedures
- KRIncrease report accuracy by 20% through intensive data validation by quarter-end
- Regularly review and correct data errors
- Train staff on improved data collection methods
- Implement stricter data validation procedures immediately
OKRs to implement comprehensive funnel reporting system
- ObjectiveImplement comprehensive funnel reporting system
- KROutline necessary data points for funnel reporting within two weeks
- Determine necessary metrics to track customer behavior
- Identify key stages in the sales process for data collection
- Schedule a meeting to discuss and finalize data points
- KRDevelop a system for automated data collection and analysis by month's end
- Identify required data points for automated collection
- Design and structure the system architecture
- Test and finalize system for data analysis
- KRShare insightful funnel reports with decision-makers bi-weekly, ensuring data-driven decisions
- Schedule bi-weekly meetings with decision-makers
- Present data and discuss insights during meetings
- Compile funnel analysis report every two weeks
OKRs to enhance efficiency of month end reporting process
- ObjectiveEnhance efficiency of month end reporting process
- KRAutomate 30% of manual reporting tasks
- Implement and test automated tasks
- Choose appropriate reporting automation software
- Identify repeatable and time-consuming manual reporting tasks
- KRIncrease report accuracy by eliminating all data discrepancies
- Develop a standardized data input procedure
- Train staff on data accuracy best practices
- Implement regular data auditing processes
- KRReduce average report generation time by 25%
- Implement automation software to expedite tasks
- Train staff to efficiently utilize reporting tools
- Review and streamline the current report generation process
OKRs to streamline and enhance data reporting and automation processes
- ObjectiveStreamline and enhance data reporting and automation processes
- KRAchieve 100% data integrity for all reports through automated validation checks
- Regularly review and update the validation parameters
- Develop an automated validation check system
- Identify all data sources for reporting accuracy
- KRSimplify and align 10 major reports for easier understanding and cross-functional use
- Develop a unified structure/format for all reports
- Condense information and eliminate unnecessary details
- Identify key data points and commonalities across all reports
- KREnable real-time data connections across 5 key systems to streamline reporting
- Test real-time reporting for data accuracy and timeliness
- Develop and implement a centralized data synchronization process
- Identify the 5 primary systems for data integration and real-time connections
OKRs to complete the Financial Statement promptly
- ObjectiveComplete the Financial Statement promptly
- KRStreamline the auditing and approval process by 15%
- Implement automated systems to expedite the auditing process
- Reduce approval stages and unnecessary checks
- Train staff to increase proficiency in audit procedures
- KRReduce errors in financial reporting by 20%
- Provide ongoing accounting training for staff
- Implement stricter internal audit protocols
- Invest in automated financial reporting software
- KRIncrease efficiency in data collection and processing by 30%
- Streamline data validation and consolidation processes
- Train staff on efficient data management strategies
- Implement automated systems for data collection and processing
OKRs to improve proficiency in manual and automation testing
- ObjectiveImprove proficiency in manual and automation testing
- KRSuccessfully identify and report 90% of bugs in 5 assigned projects
- Conduct thorough bug detection in each assigned project
- Generate comprehensive bug reports for management
- Document and categorize each identified bug
- KRComplete three advanced courses in manual and automation testing with at least 85% score
- Research and enroll in manual and automation testing courses
- Consistently study course materials for understanding
- Achieve 85% or more on all course exams
- KRIncrease testing speed by 30% without sacrificing quality of test results
- Streamline test procedures to eliminate redundancies
- Train staff on efficiency and time management tactics
- Implement automation for repetitive test procedures
OKRs to implement robust tracking of core Quality Assurance (QA) metrics
- ObjectiveImplement robust tracking of core Quality Assurance (QA) metrics
- KRDevelop an automated QA metrics tracking system within two weeks
- Identify necessary metrics for quality assurance tracking
- Research and select software for automation process
- Configure software to track and report desired metrics
- KRDeliver biweekly reports showing improvements in tracked QA metrics
- Compile and submit a biweekly improvement report
- Highlight significant improvements in collected QA data
- Gather and analyze QA metrics data every two weeks
- KRAchieve 100% accuracy in data capture on QA metrics by month three
Reporting Automation OKR best practices
Generally speaking, your objectives should be ambitious yet achievable, and your key results should be measurable and time-bound (using the SMART framework can be helpful). It is also recommended to list strategic initiatives under your key results, as it'll help you avoid the common mistake of listing projects in your KRs.
Here are a couple of best practices extracted from our OKR implementation guide 👇
Tip #1: Limit the number of key results
Having too many OKRs is the #1 mistake that teams make when adopting the framework. The problem with tracking too many competing goals is that it will be hard for your team to know what really matters.
We recommend having 3-4 objectives, and 3-4 key results per objective. A platform like Tability can run audits on your data to help you identify the plans that have too many goals.
Tip #2: Commit to weekly OKR check-ins
Setting good goals can be challenging, but without regular check-ins, your team will struggle to make progress. We recommend that you track your OKRs weekly to get the full benefits from the framework.
Being able to see trends for your key results will also keep yourself honest.
Tip #3: No more than 2 yellow statuses in a row
Yes, this is another tip for goal-tracking instead of goal-setting (but you'll get plenty of OKR examples above). But, once you have your goals defined, it will be your ability to keep the right sense of urgency that will make the difference.
As a rule of thumb, it's best to avoid having more than 2 yellow/at risk statuses in a row.
Make a call on the 3rd update. You should be either back on track, or off track. This sounds harsh but it's the best way to signal risks early enough to fix things.
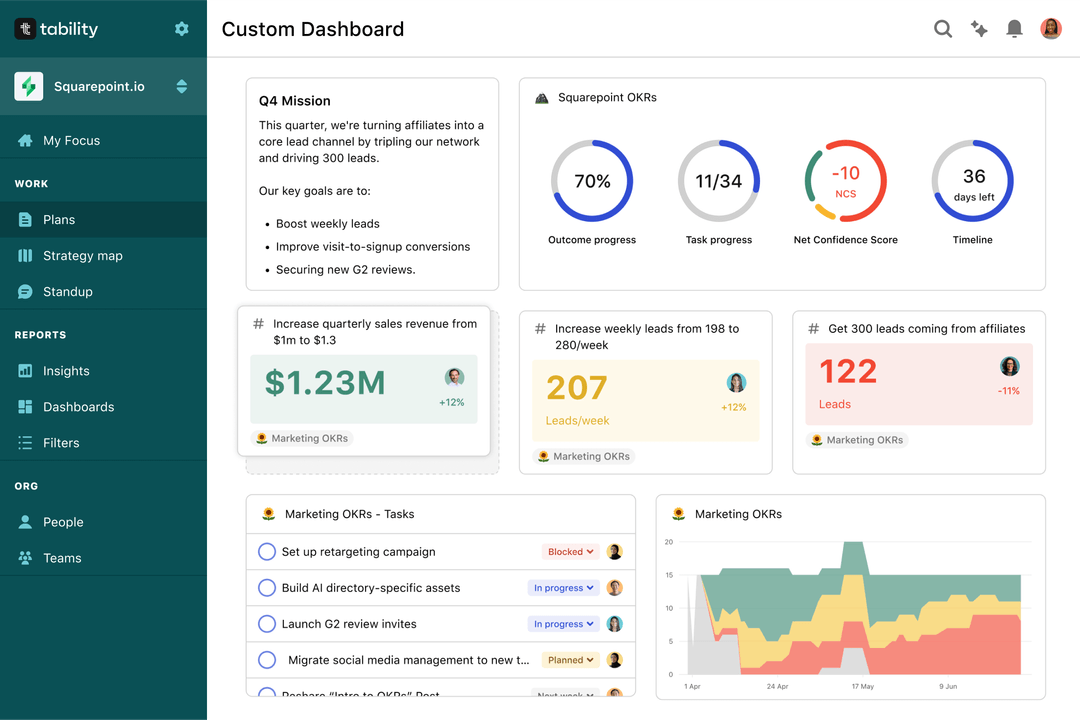
Save hours with automated Reporting Automation OKR dashboards
Quarterly OKRs should have weekly updates to get all the benefits from the framework. Reviewing progress periodically has several advantages:
- It brings the goals back to the top of the mind
- It will highlight poorly set OKRs
- It will surface execution risks
- It improves transparency and accountability
Spreadsheets are enough to get started. Then, once you need to scale you can use Tability to save time with automated OKR dashboards, data connectors, and actionable insights.
How to get Tability dashboards:
- 1. Create a Tability account
- 2. Use the importers to add your OKRs (works with any spreadsheet or doc)
- 3. Publish your OKR plan
That's it! Tability will instantly get access to 10+ dashboards to monitor progress, visualise trends, and identify risks early.
More Reporting Automation OKR templates
We have more templates to help you draft your team goals and OKRs.
- OKRs to enhance customer experience in purchasing and selling journey
- OKRs to establish an efficient, regulations-compliant team
- OKRs to assess standard price impact on profitability
- OKRs to successfully launch 20 e-services online
- OKRs to improve Security Operation Centre Incident Response
- OKRs to establish a high engagement and satisfaction work environment