OKR template to implement automation in data analysis and visualization
This operations OKR template is a strong starting point for teams that need better alignment, clearer priorities, and more disciplined goal tracking.
Use it to turn a business priority into a measurable objective, then review progress weekly so your team can adjust execution before the quarter gets away from you.
Your OKR template
The second key outcome involves automating half of the regular data analysis tasks to increase the overall efficiency. This requires identifying the routine data analysis tasks suitable for automation, testing implemented tools, and researching to select the most relevant automation software. This creates a streamlined process, ensuring resources are used optimally and reducing workload.
The final outcome focuses on developing a comprehensive automated script for data cleaning and pre-processing by the end of the first quarter. The initiatives here include designing an algorithm, implementing and testing the automation script, and identifying the necessary steps for data cleaning and preprocessing. The clean and pre-processed data will improve the quality of analysis and visualization.
Overall, the OKR places significant emphasis on leveraging technology to improve data visualization and analysis processes. It intends to streamline the operations while enhancing the final output quality. By implementing strategic automation, it aims to free up resources, improve efficiency, and potentially discover further data insights.
 ObjectiveImplement automation in data analysis and visualization
 KRCreate an automated data visualization tool generating 3 visually impacting reports weekly
 Identify key data points for weekly visualization
- Design three types of impactful report templates
- Program automation for weekly report generation
- KRSuccessfully automate 50% of routine data analysis tasks to increase efficiency
- Implement and test chosen automation tools
- Identify routine data analysis tasks suitable for automation
- Research and select relevant automation software
- KRDevelop a robust data cleaning and pre-processing automation script by the end of Q1
- Design algorithm for automation script
- Implement and test the automation script
- Identify necessary data cleaning and preprocessing steps
Tability: the best OKR software for results-driven teams
OKRs should be tracked weekly to be effective, and Tability is the perfect tool for that.
Tability is the best OKR software that embraces modern principles to help teams set better goals, monitor execution, and get help to achieve their objectives faster.
With Tability you can:
- Get an OKR agent that can review existing OKRs, suggest improvements, and monitor execution
- Connect your OKRs and team goals to Jira, ClickUp, Linear, Asana, and more
- Automate reporting with integrations and built-in dashboard
You can import OKRs in seconds with the magic importer, and start executing your goals in no time.
Step 1. Sign up for a free Tability account
Go tohttps://tability.app/signup and create your account (it's free!)
Step 2. Create a plan
Follow the steps after your onboarding to create your first plan, you should get to a page that looks like the picture below.
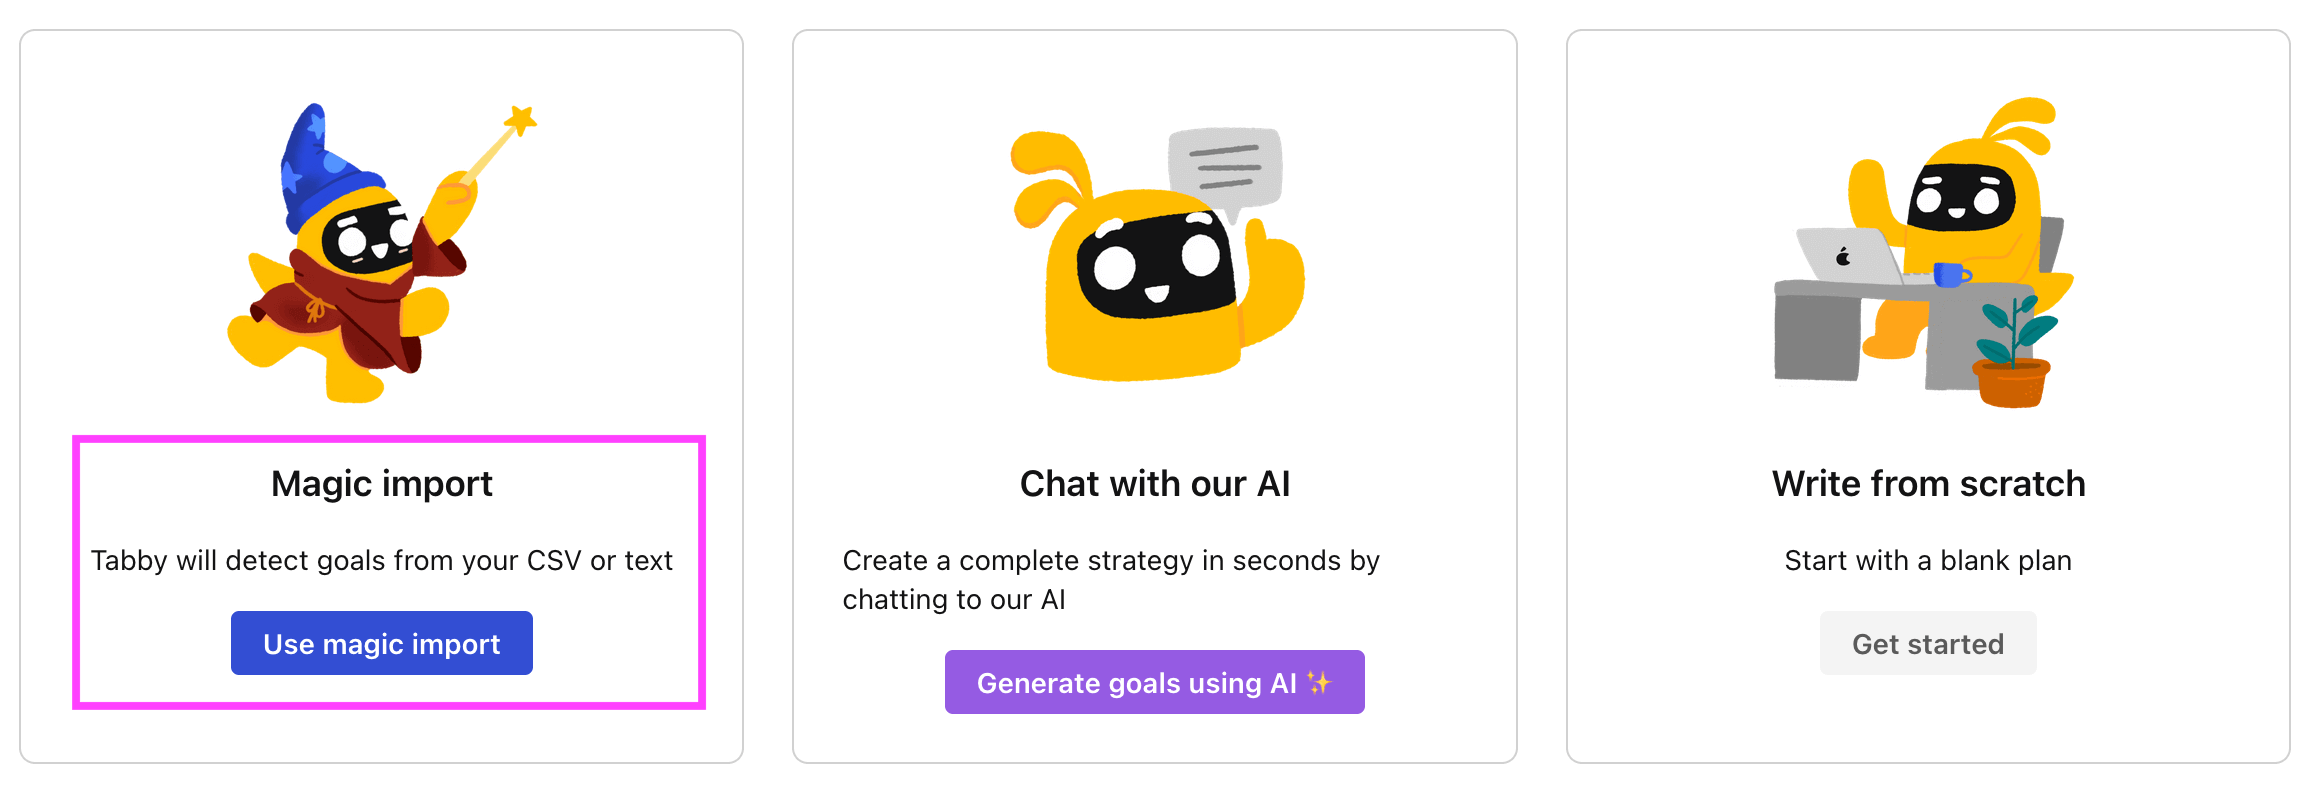
Step 3. Use the magic importer
Click on Use magic import to open up the Magic Import modal.
Now, go back to the OKR examples, and click on Copy on the example that you’d like to use.

Paste the content in the text import section. Don’t worry about the formatting, Tability’s AI will be able to parse it!
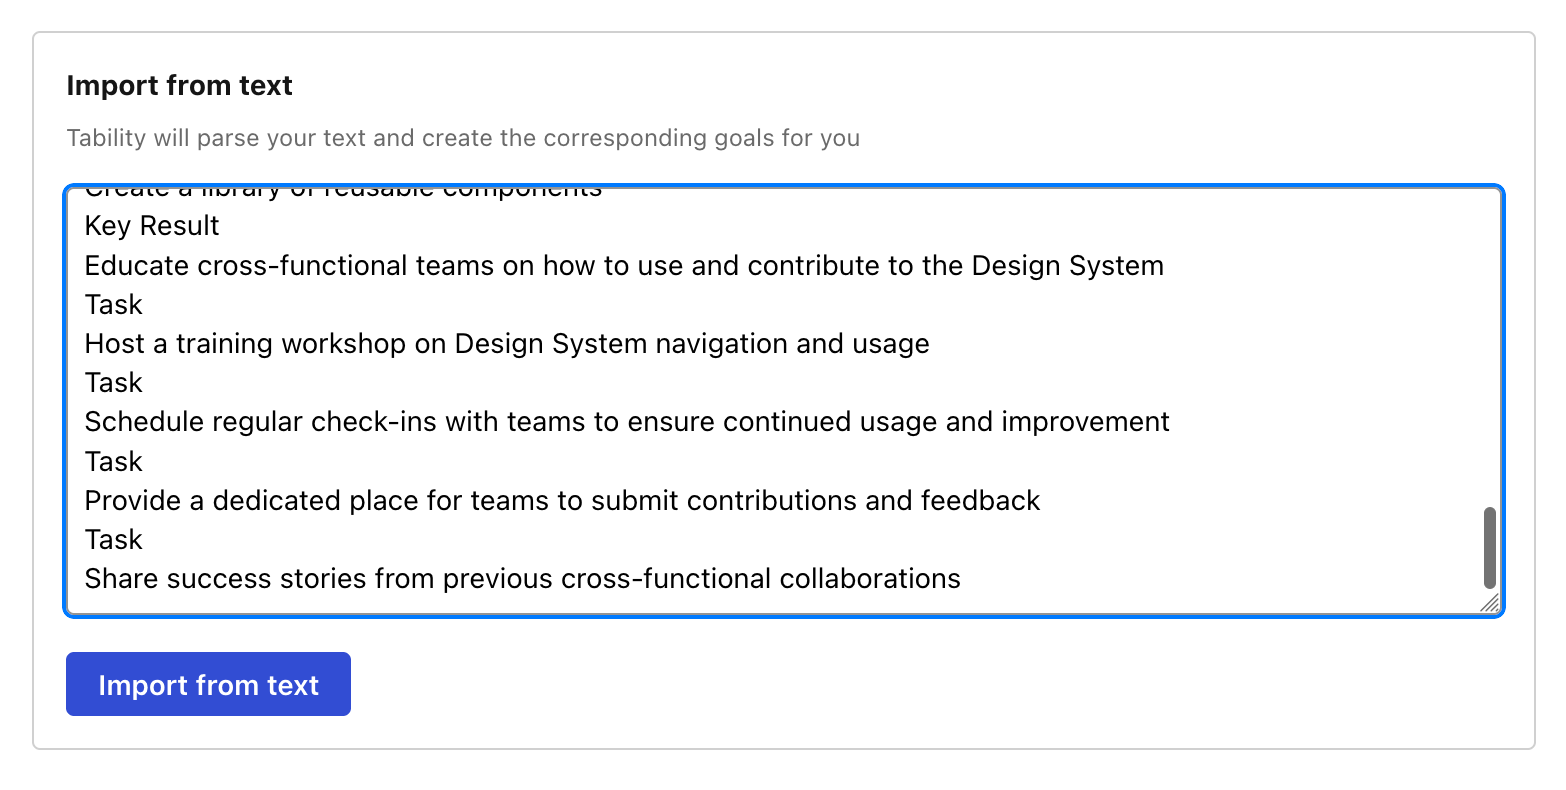
Now, just click on Import from text and let the magic happen.
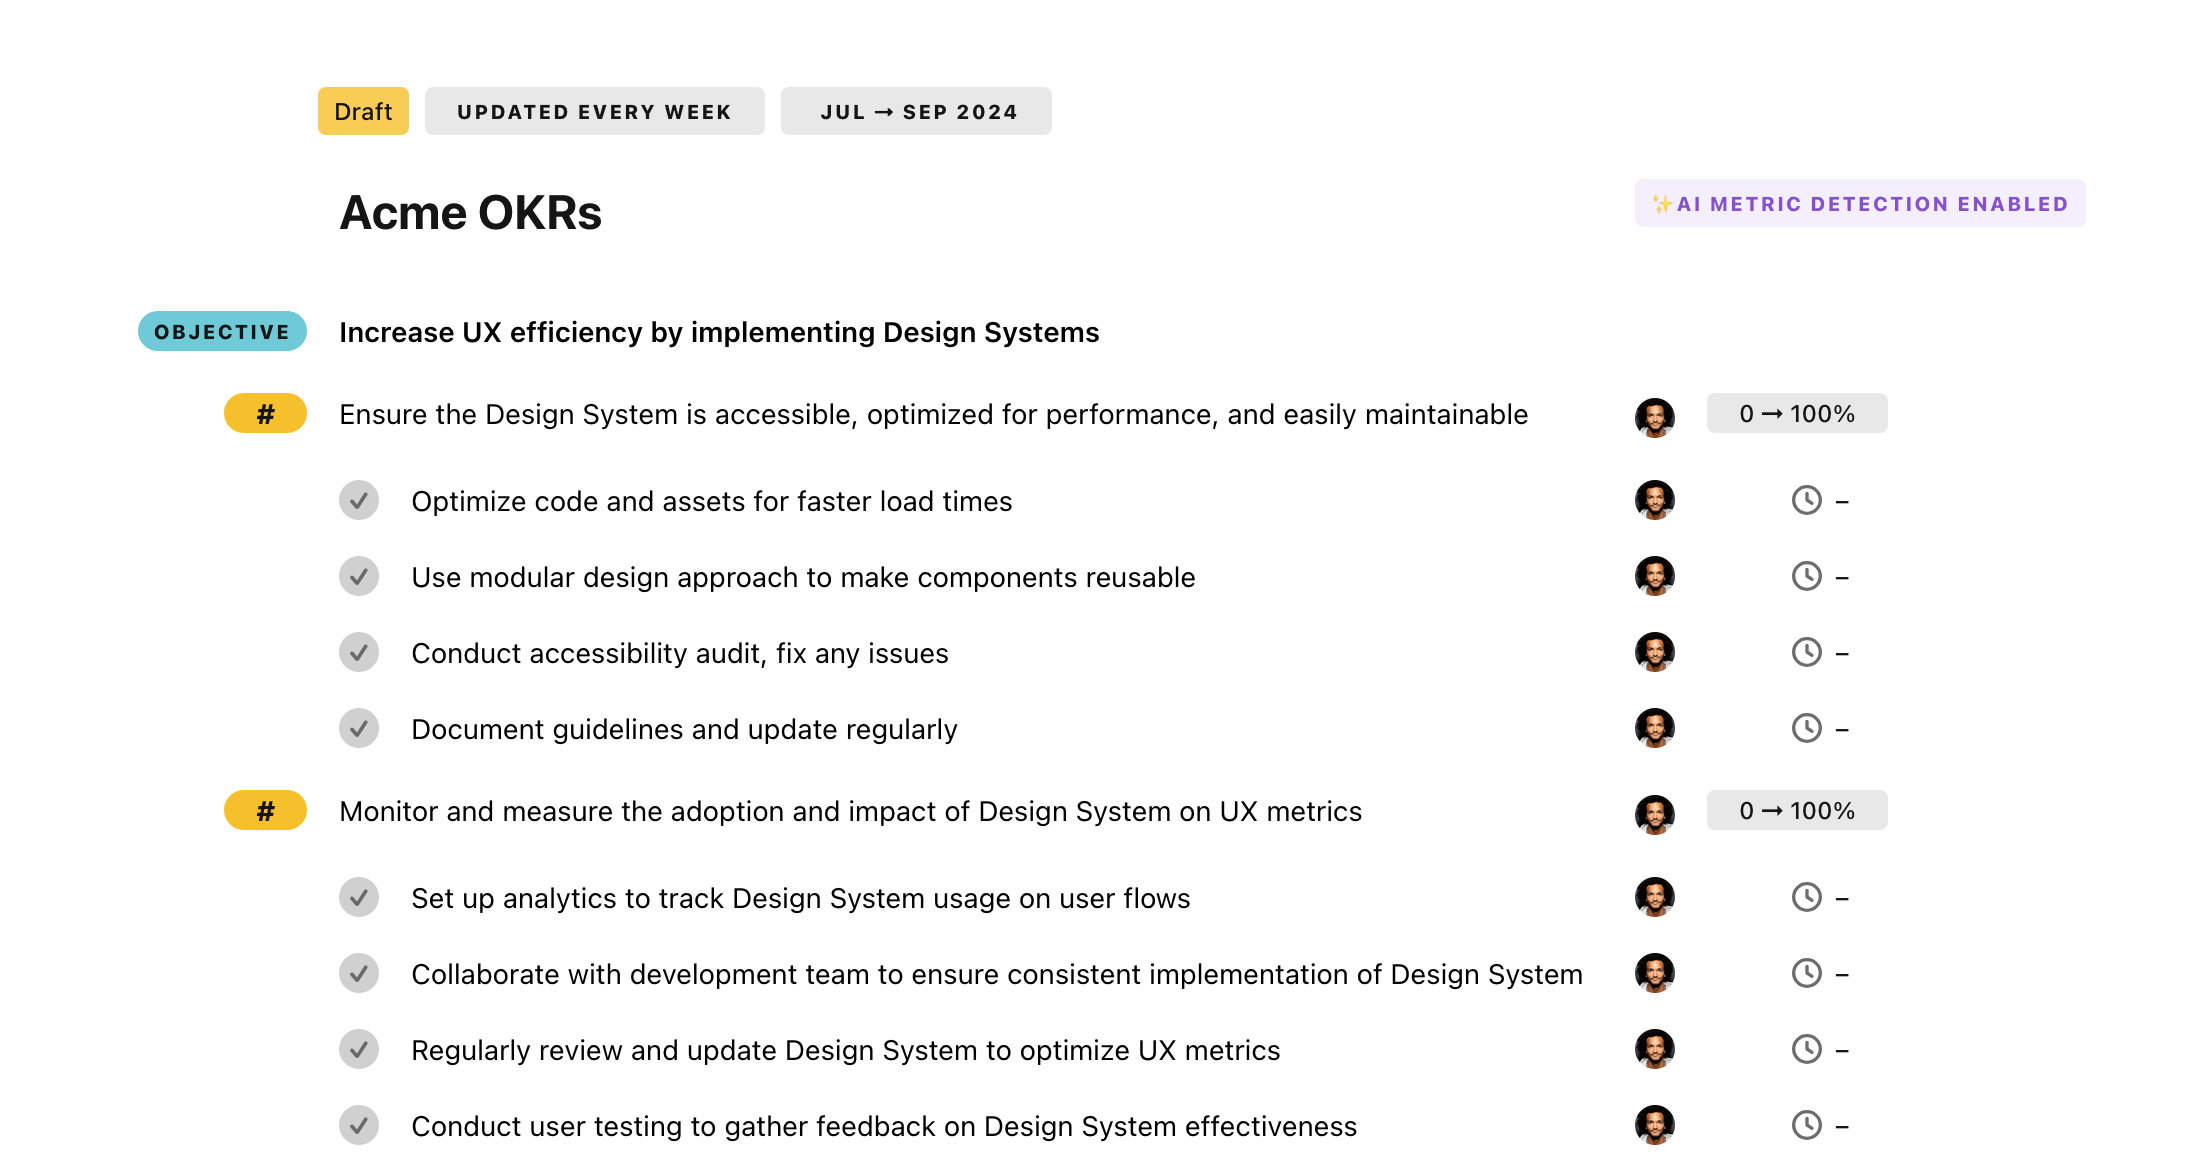
Once your example is in the plan editor, you will be able to:
- Edit the objectives, key results, and tasks
- Click on the target 0 → 100% to set better target
- Use the tips and the AI to refine your goals
Step 4. Publish your plan
Once you’re done editing, you can publish your plan to switch to the goal-tracking mode.
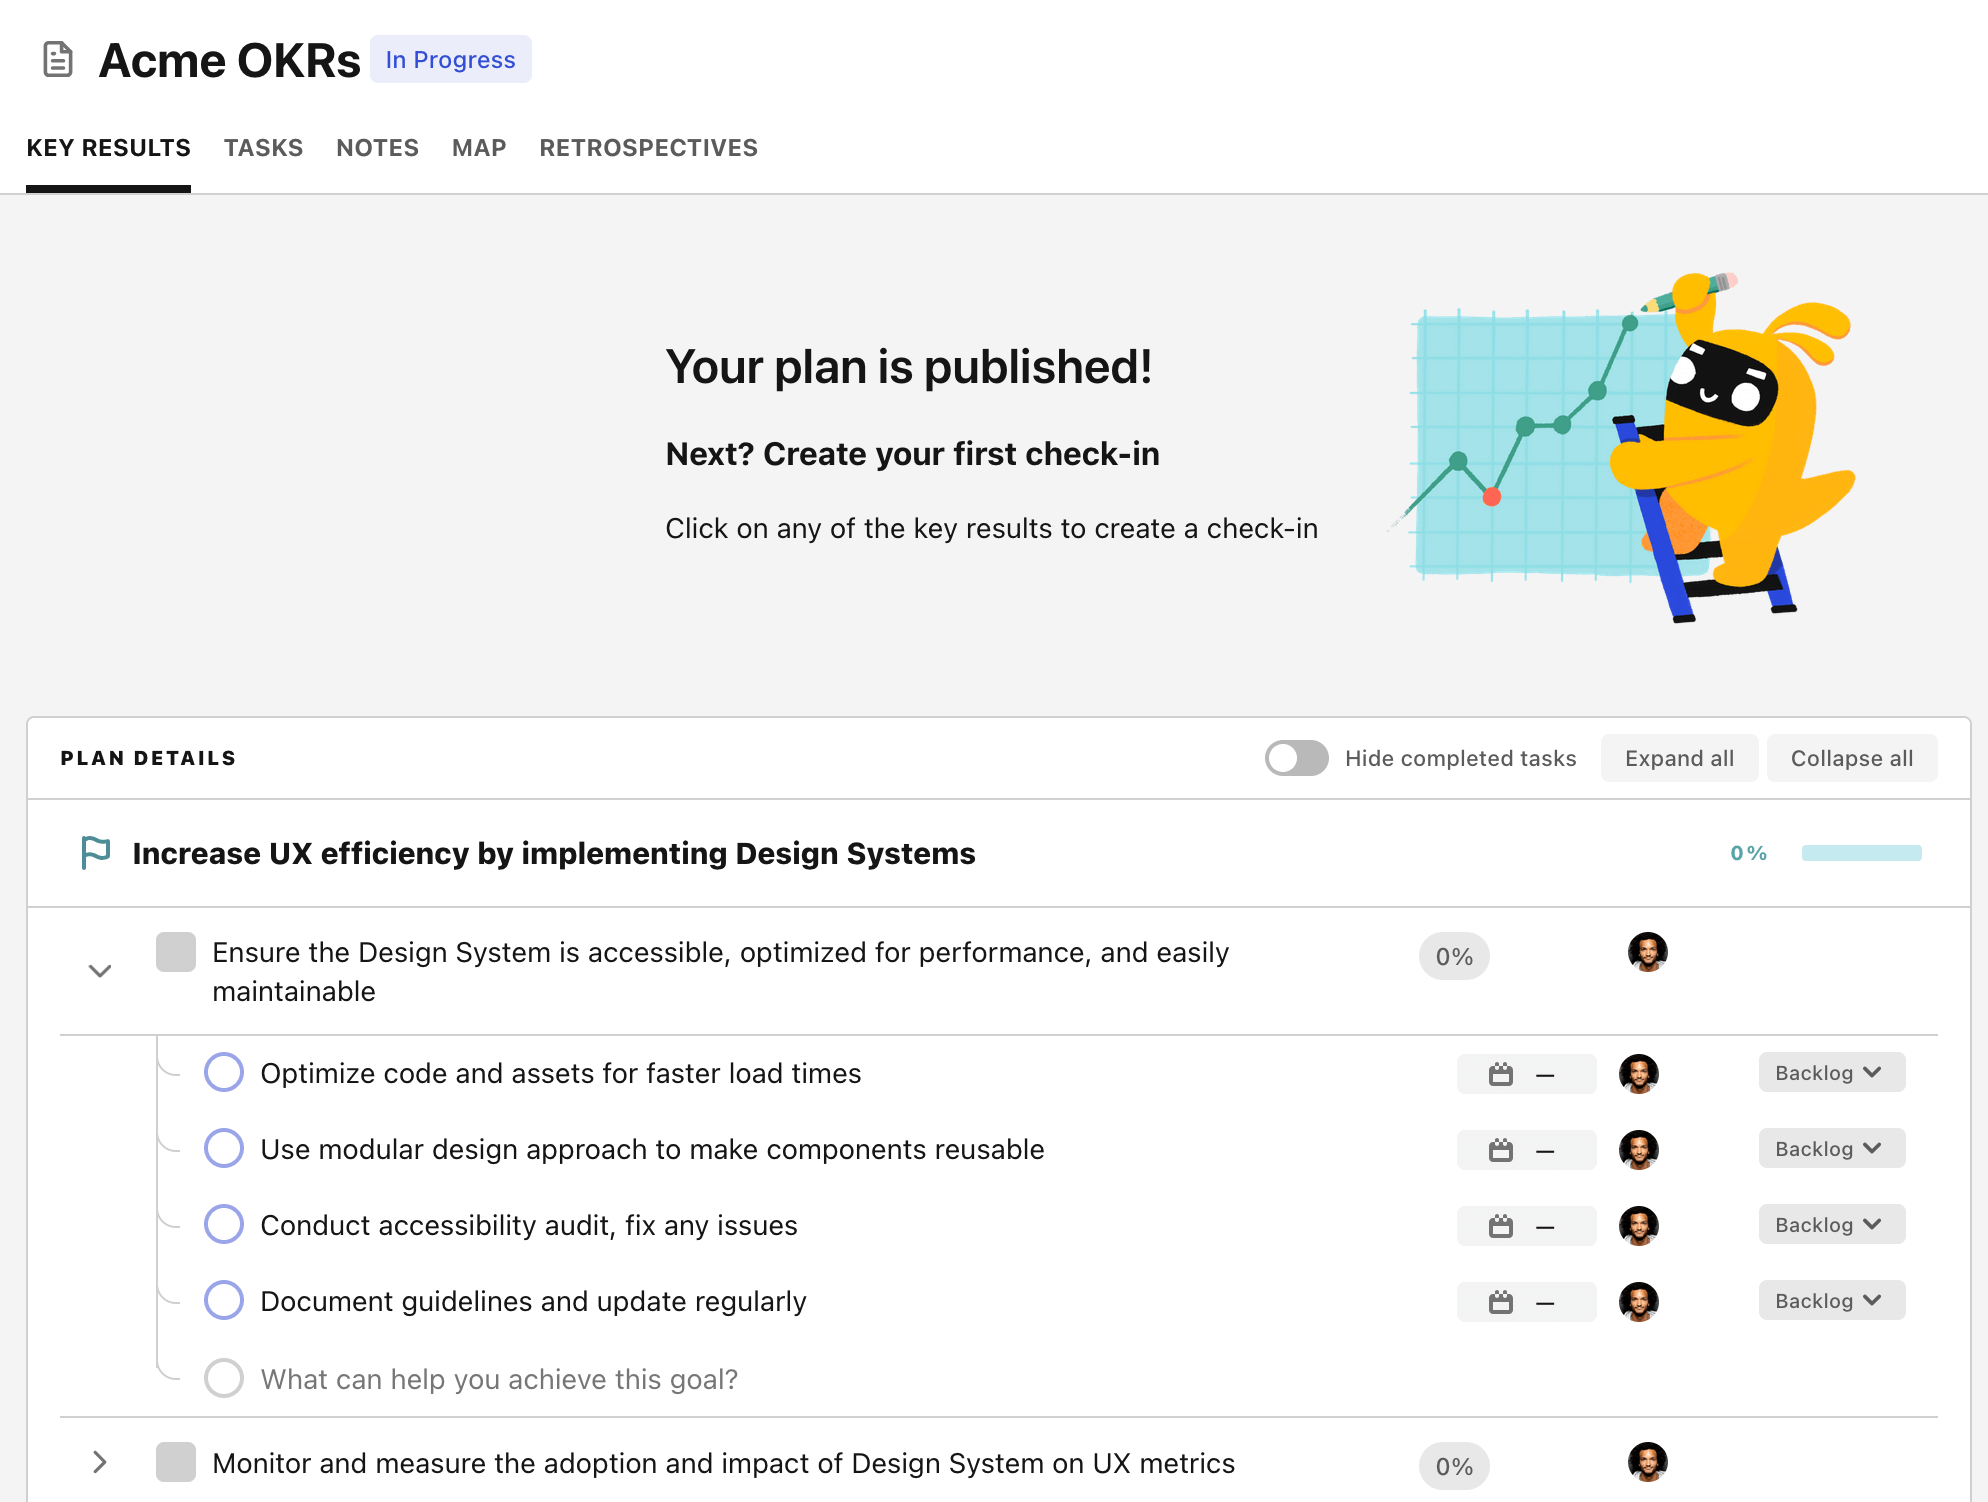
From there you will have access to all the features that will help you and your team save hours with OKR reporting.
- 10+ built-in dashboards to visualise progress on your goals
- Weekly reminders, data connectors, and smart notifications
- 9 views to map OKRs to strategic projects
- Strategy map to align teams at scale