Tability is a cheatcode for goal-driven teams. Set perfect OKRs with AI, stay focused on the work that matters.
What are Data Engineering OKRs?
The Objective and Key Results (OKR) framework is a simple goal-setting methodology that was introduced at Intel by Andy Grove in the 70s. It became popular after John Doerr introduced it to Google in the 90s, and it's now used by teams of all sizes to set and track ambitious goals at scale.
Formulating strong OKRs can be a complex endeavor, particularly for first-timers. Prioritizing outcomes over projects is crucial when developing your plans.
To aid you in setting your goals, we have compiled a collection of OKR examples customized for Data Engineering. Take a look at the templates below for inspiration and guidance.
If you want to learn more about the framework, you can read our OKR guide online.
The best tools for writing perfect Data Engineering OKRs
Here are 2 tools that can help you draft your OKRs in no time.
Tability AI: to generate OKRs based on a prompt
Tability AI allows you to describe your goals in a prompt, and generate a fully editable OKR template in seconds.
- 1. Create a Tability account
- 2. Click on the Generate goals using AI
- 3. Describe your goals in a prompt
- 4. Get your fully editable OKR template
- 5. Publish to start tracking progress and get automated OKR dashboards
Watch the video below to see it in action 👇
Tability Feedback: to improve existing OKRs
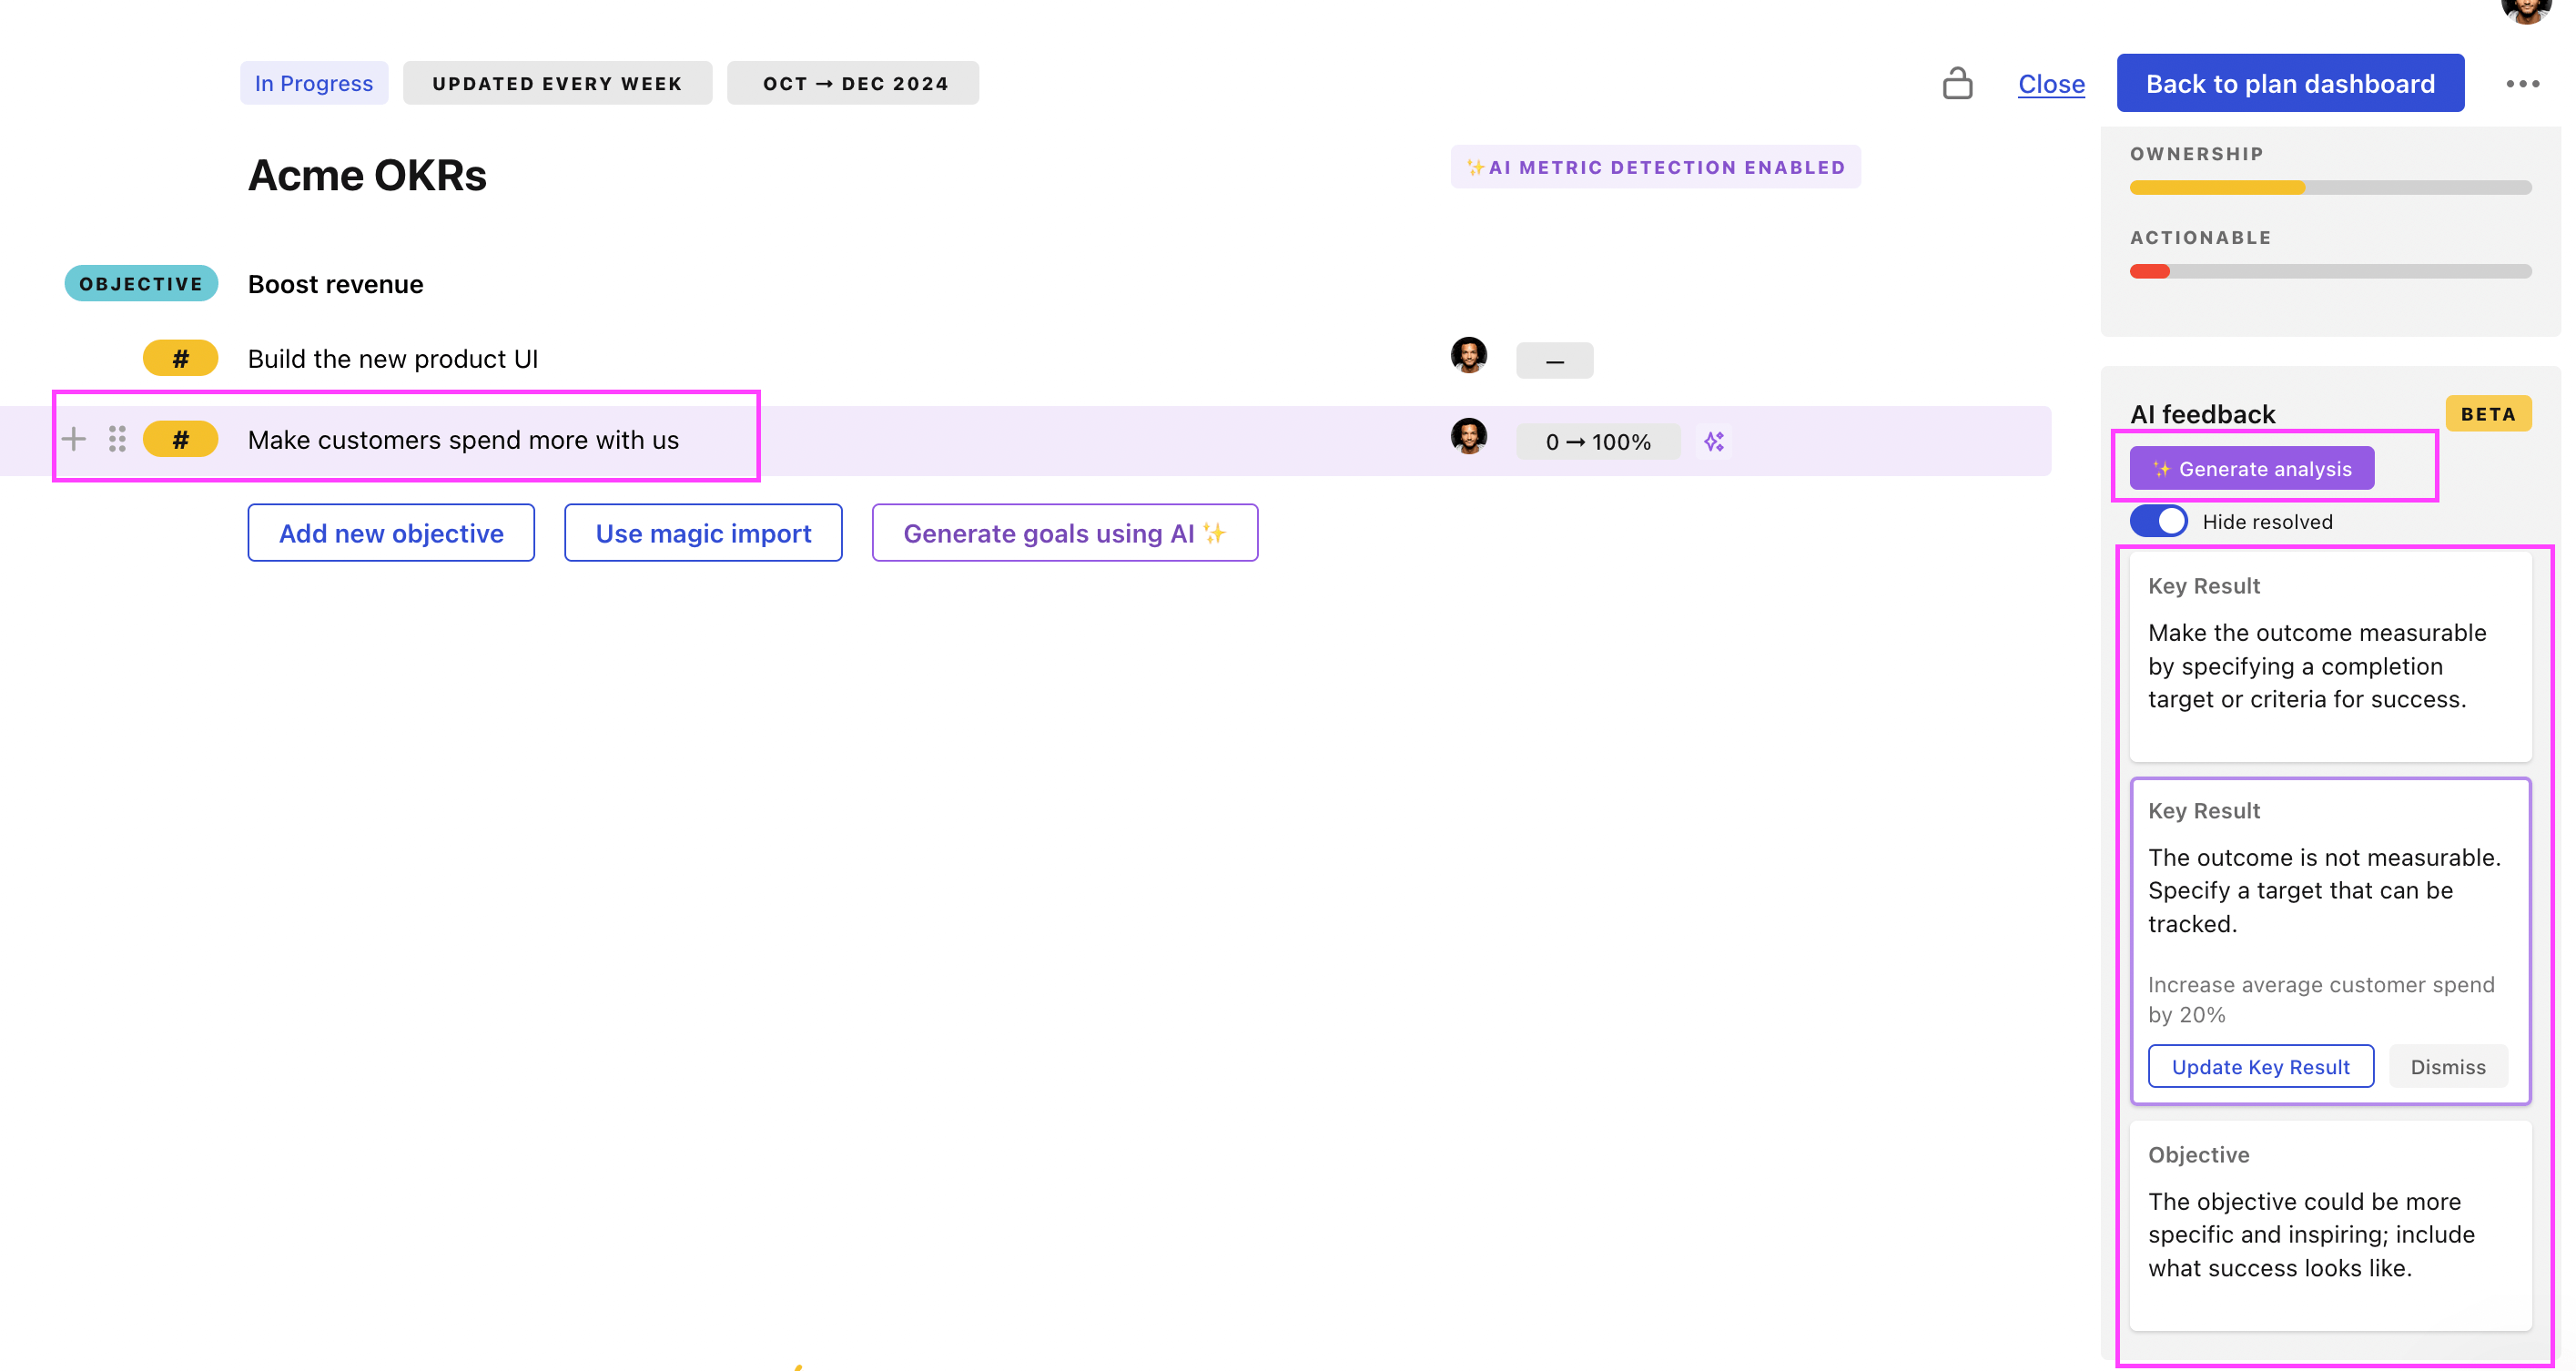
You can use Tability's AI feedback to improve your OKRs if you already have existing goals.
- 1. Create your Tability account
- 2. Add your existing OKRs (you can import them from a spreadsheet)
- 3. Click on Generate analysis
- 4. Review the suggestions and decide to accept or dismiss them
- 5. Publish to start tracking progress and get automated OKR dashboards

Tability will scan your OKRs and offer different suggestions to improve them. This can range from a small rewrite of a statement to make it clearer to a complete rewrite of the entire OKR.
Data Engineering OKRs examples
You'll find below a list of Objectives and Key Results templates for Data Engineering. We also included strategic projects for each template to make it easier to understand the difference between key results and projects.
Hope you'll find this helpful!
OKRs to improve interoperability between data engineering teams
ObjectiveImprove interoperability between data engineering teams
KROffer biweekly data interoperability training to 90% of data engineering teams
Identify 90% of data engineering teams for training
Develop a biweekly interoperability training schedule
Implement and monitor the data interoperability training
KRReduce cross-team data discrepancies by 50%, ensuring increased data consistency
Regularly audit and correct data discrepancies across all teams
Implement a standardized data entry and management process for all teams
Utilize data synchronization tools for seamless data integration
KRImplement standardized data protocols across all teams increasing cross-collaboration by 30%
Train teams on new standardized protocols
Identify current data protocols in each team
Draft and propose unified data protocols
OKRs to enhance data engineering capabilities to drive software innovation
ObjectiveEnhance data engineering capabilities to drive software innovation
KRImprove data quality by implementing automated data validation and monitoring processes
Implement chosen data validation tool
Research various automated data validation tools
Regularly monitor and assess data quality
KREnhance software scalability by optimizing data storage and retrieval mechanisms for large datasets
Optimize SQL queries for faster data retrieval
Adopt a scalable distributed storage system
Implement a more efficient database indexing system
KRIncrease data processing efficiency by optimizing data ingestion pipelines and reducing processing time
Develop optimization strategies for lagging pipelines
Implement solutions to reduce data processing time
Analyze current data ingestion pipelines for efficiency gaps
OKRs to improve the quality of the data
ObjectiveSignificantly improve the quality of the data
KRReduce the number of data capture errors by 30%
KRReduce delay for data availability from 24h to 4h
KRClose top 10 issues relating to data accuracy
OKRs to reduce the cost of integrating data sources
ObjectiveReduce the cost of data integration
KRDecrease the time to integrate new data sources from 2 days to 4h
Migrate data sources to Segment
Create a shared library to streamline integrations
KRReduce the time to create new dashboards from 4 days to <1h
Adopt BI tool to allow users to create their own dashboards
KR10 teams have used successfully a self-serve dashboard creation system
OKRs to build a robust data pipeline utilizing existing tools
ObjectiveBuild a robust data pipeline utilizing existing tools
KRSuccessfully test and deploy the data pipeline with zero critical defects by the end of week 10
Deploy the final pipeline by week 10
Thoroughly debug and test the data pipeline
Fix identified issues before end of week 9
KRIdentify and document 100% of necessary features and tools by the end of week 2
Review product requirements and existing toolsets
Conduct brainstorming sessions for necessary features
Document all identified features and tools
KRAchieve 75% completion of the data pipeline design and construction by week 6
Continually review and improve design stages for efficiency
Allocate resources for swift pipeline design and construction
Establish milestones and monitor progress each week
OKRs to deploy robust reporting platform
ObjectiveDeploy robust reporting platform
KRIdentify and integrate relevant data sources into the platform by 50%
Monitor and adjust integration to achieve 50% completion
Implement data integration strategies for identified sources
Identify relevant sources of data for platform integration
KREnsure 95% of platform uptime with efficient maintenance and quick bug resolution
Develop fast and effective bug resolution processes
Implement regular system checks and predictive maintenance
Monitor platform uptime continuously for efficiency
KRAchieve user satisfaction rate of 85% through user-friendly design
Collect user feedback for necessary improvements
Implement intuitive site navigation and user interface
Regularly update design based on user feedback
OKRs to enhance the performance of Databricks pipelines
ObjectiveEnhance the performance of Databricks pipelines
KRImplement pipeline optimization changes in at least 10 projects
Start implementing the optimization changes in each project
Identify 10 projects that require pipeline optimization changes
Develop an actionable strategy for pipeline optimization
KRReduce the processing time of pipeline workflows by 30%
Implement automation for repetitive, time-consuming tasks
Upgrade hardware to enhance processing speed
Streamline workflow tasks by eliminating redundant steps
KRIncrease pipeline data load speed by 25%
Implement data compression techniques to reduce load times
Simplify data transformation to improve throughput
Upgrade current servers to enhance data processing capacity
Data Engineering OKR best practices
Generally speaking, your objectives should be ambitious yet achievable, and your key results should be measurable and time-bound (using the SMART framework can be helpful). It is also recommended to list strategic initiatives under your key results, as it'll help you avoid the common mistake of listing projects in your KRs.
Here are a couple of best practices extracted from our OKR implementation guide 👇
Tip #1: Limit the number of key results
Focus can only be achieve by limiting the number of competing priorities. It is crucial that you take the time to identify where you need to move the needle, and avoid adding business-as-usual activities to your OKRs.
We recommend having 3-4 objectives, and 3-4 key results per objective. A platform like Tability can run audits on your data to help you identify the plans that have too many goals.
Tip #2: Commit to weekly OKR check-ins
Having good goals is only half the effort. You'll get significant more value from your OKRs if you commit to a weekly check-in process.
Being able to see trends for your key results will also keep yourself honest.
Tip #3: No more than 2 yellow statuses in a row
Yes, this is another tip for goal-tracking instead of goal-setting (but you'll get plenty of OKR examples above). But, once you have your goals defined, it will be your ability to keep the right sense of urgency that will make the difference.
As a rule of thumb, it's best to avoid having more than 2 yellow/at risk statuses in a row.
Make a call on the 3rd update. You should be either back on track, or off track. This sounds harsh but it's the best way to signal risks early enough to fix things.
Save hours with automated Data Engineering OKR dashboards

The rules of OKRs are simple. Quarterly OKRs should be tracked weekly, and yearly OKRs should be tracked monthly. Reviewing progress periodically has several advantages:
- It brings the goals back to the top of the mind
- It will highlight poorly set OKRs
- It will surface execution risks
- It improves transparency and accountability
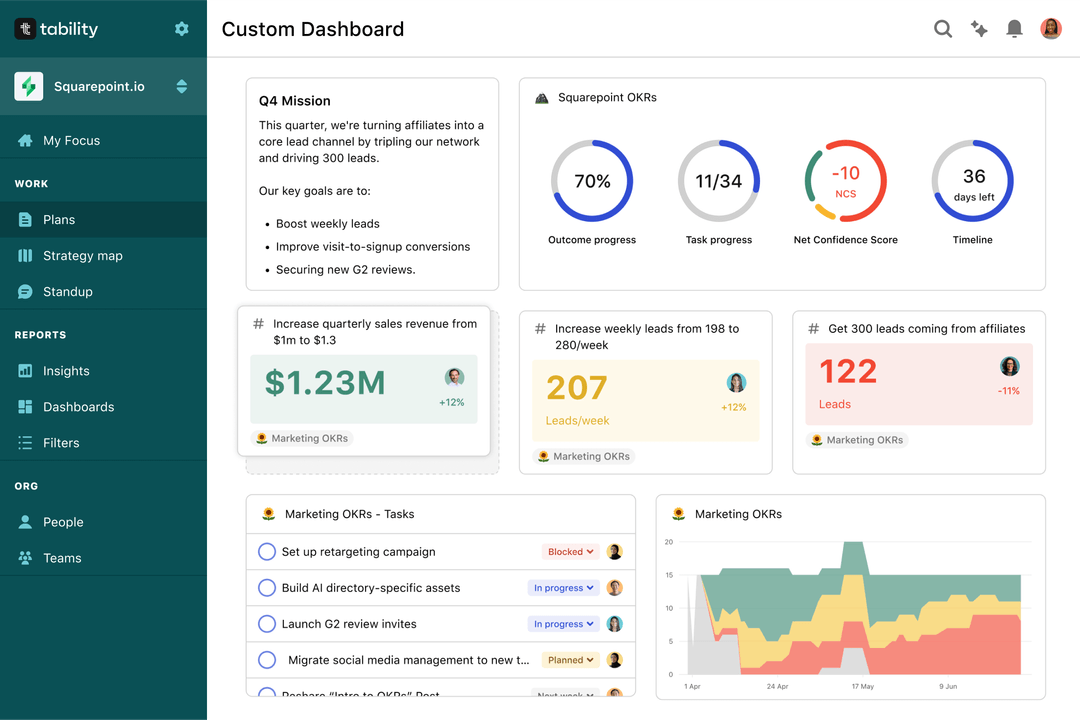
Most teams should start with a spreadsheet if they're using OKRs for the first time. Then, you can move to Tability to save time with automated OKR dashboards, data connectors, and actionable insights.
How to get Tability dashboards:
- 1. Create a Tability account
- 2. Use the importers to add your OKRs (works with any spreadsheet or doc)
- 3. Publish your OKR plan
That's it! Tability will instantly get access to 10+ dashboards to monitor progress, visualise trends, and identify risks early.
More Data Engineering OKR templates
We have more templates to help you draft your team goals and OKRs.
OKRs to achieve a B grade in all subjects
OKRs to enhance nonprofits' performance through capacity-strengthening interventions
OKRs to develop an extensive asset library for product and merchandise designs
OKRs to amplify brand popularity and reach across all digital platforms
OKRs to increase revenue streams for the company
OKRs to successfully complete final school quarter for graduation