Tability is a cheatcode for goal-driven teams. Set perfect OKRs with AI, stay focused on the work that matters.
What are Master Data OKRs?
The Objective and Key Results (OKR) framework is a simple goal-setting methodology that was introduced at Intel by Andy Grove in the 70s. It became popular after John Doerr introduced it to Google in the 90s, and it's now used by teams of all sizes to set and track ambitious goals at scale.
How you write your OKRs can make a huge difference on the impact that your team will have at the end of the quarter. But, it's not always easy to write a quarterly plan that focuses on outcomes instead of projects.
That's why we have created a list of OKRs examples for Master Data to help. You can use any of the templates below as a starting point to write your own goals.
If you want to learn more about the framework, you can read our OKR guide online.
The best tools for writing perfect Master Data OKRs
Here are 2 tools that can help you draft your OKRs in no time.
Tability AI: to generate OKRs based on a prompt
Tability AI allows you to describe your goals in a prompt, and generate a fully editable OKR template in seconds.
- 1. Create a Tability account
- 2. Click on the Generate goals using AI
- 3. Describe your goals in a prompt
- 4. Get your fully editable OKR template
- 5. Publish to start tracking progress and get automated OKR dashboards
Watch the video below to see it in action 👇
Tability Feedback: to improve existing OKRs
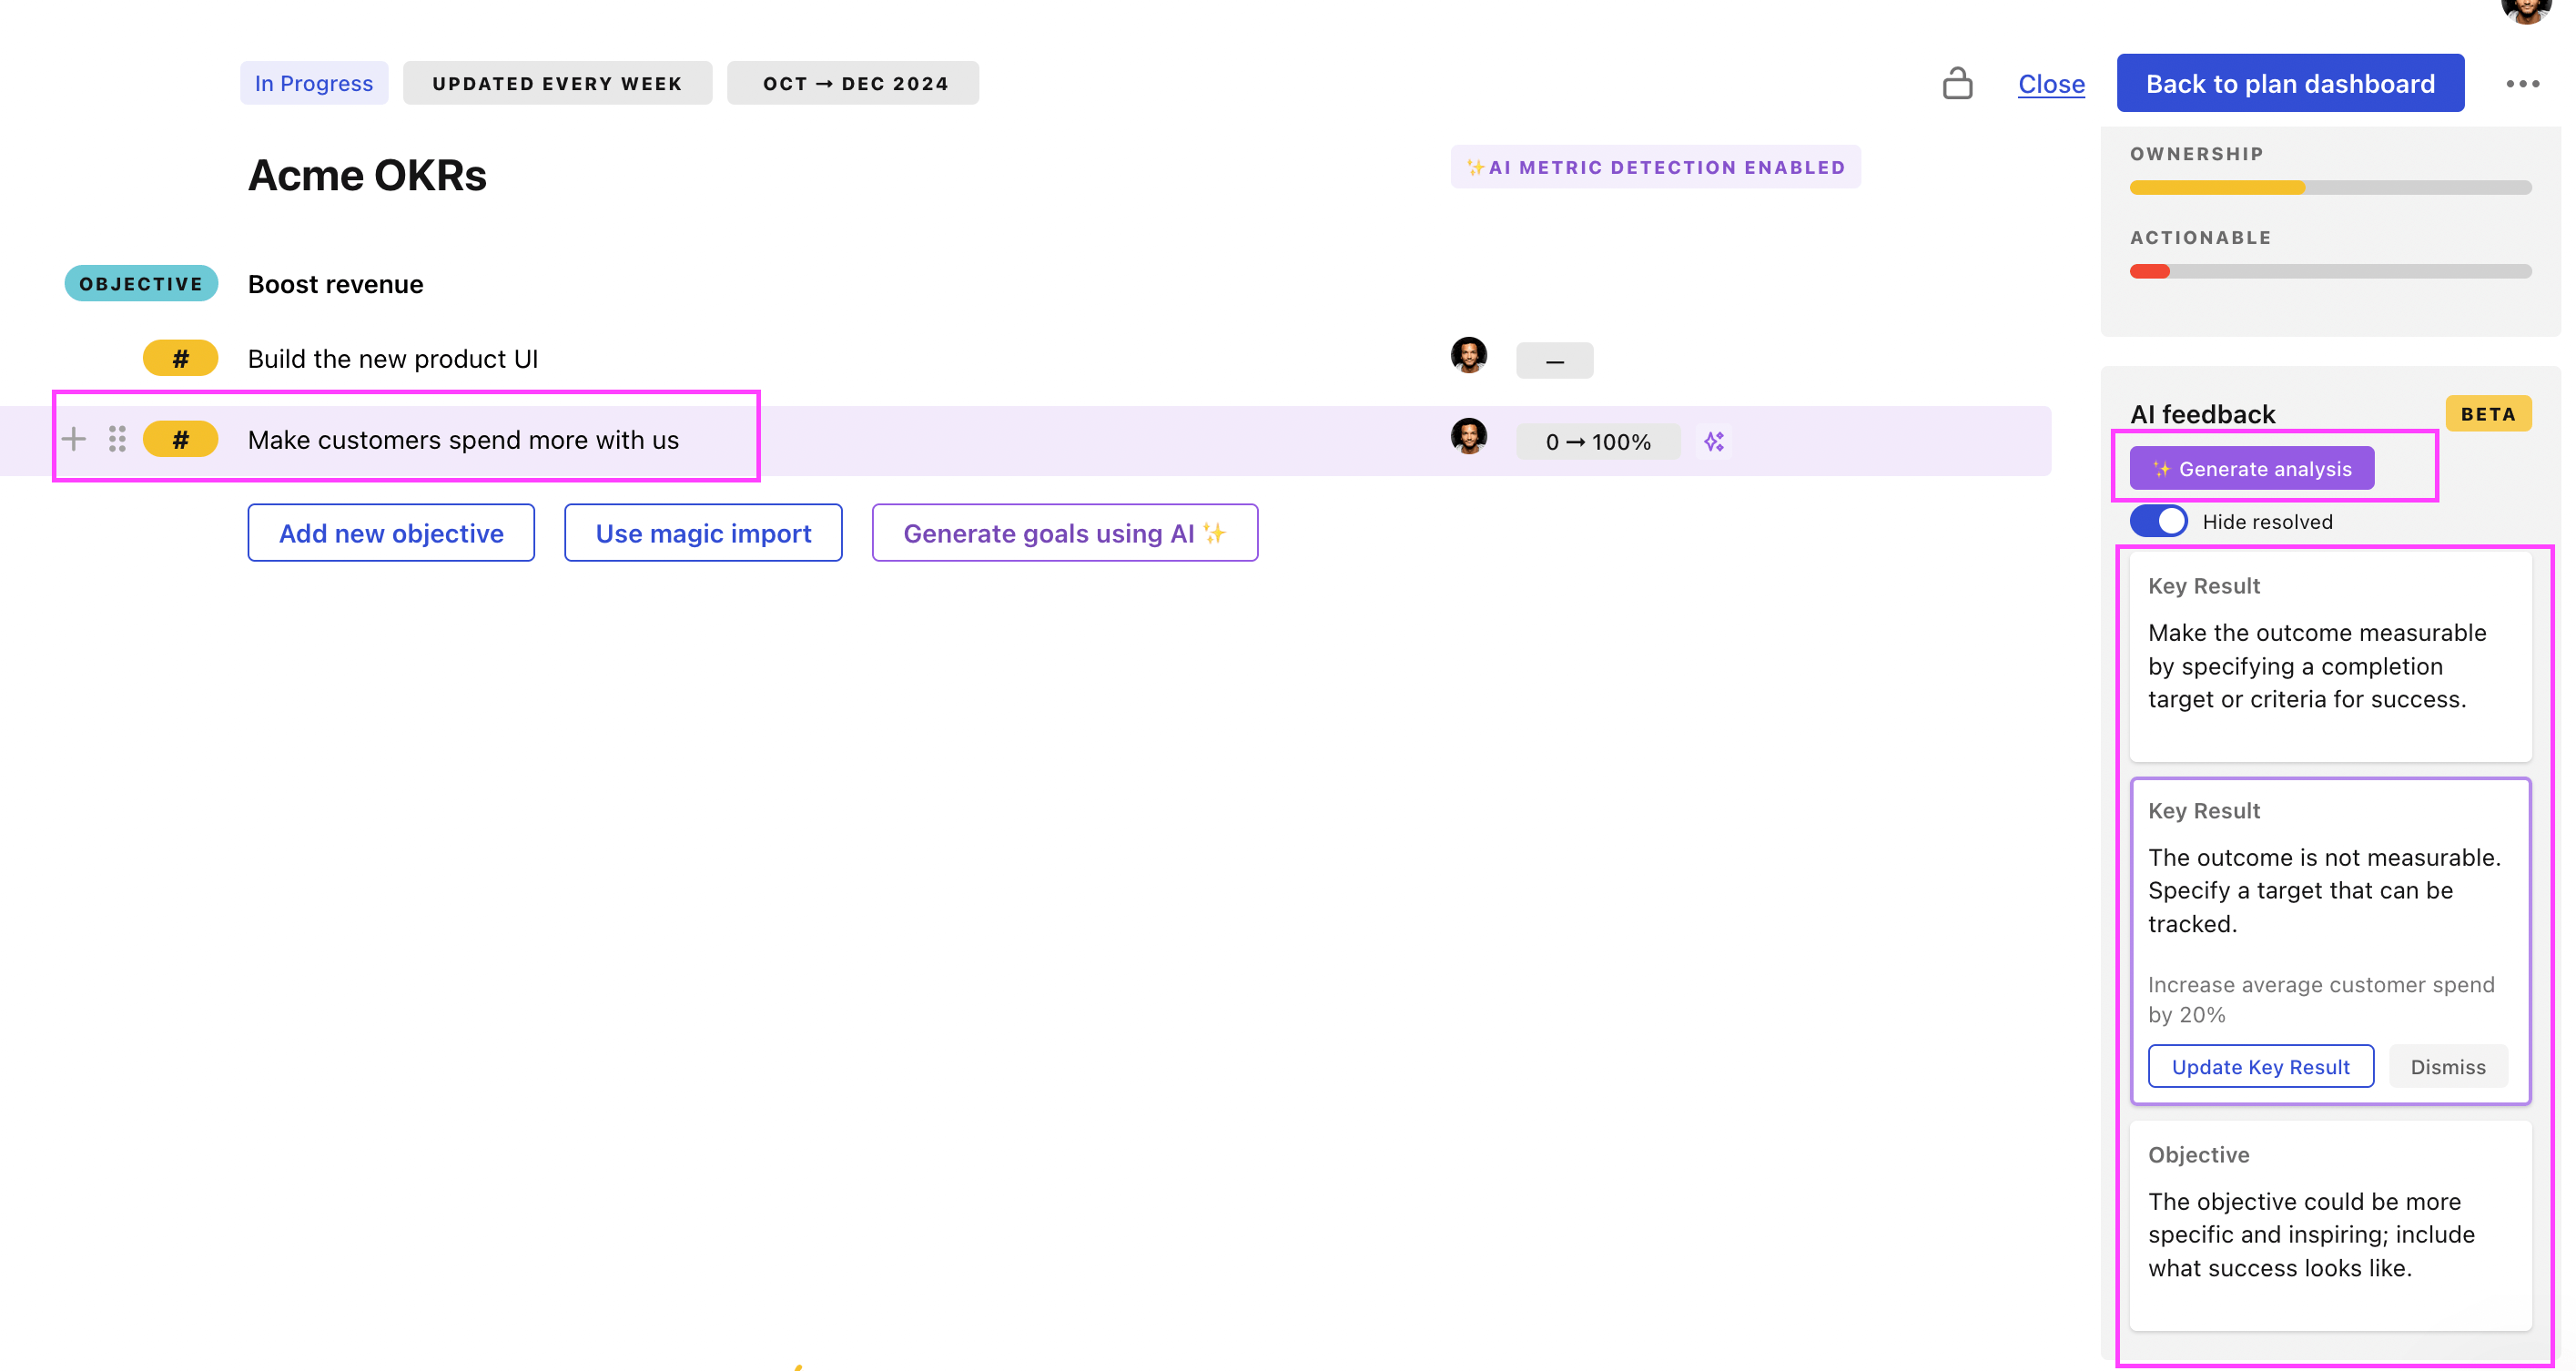
You can use Tability's AI feedback to improve your OKRs if you already have existing goals.
- 1. Create your Tability account
- 2. Add your existing OKRs (you can import them from a spreadsheet)
- 3. Click on Generate analysis
- 4. Review the suggestions and decide to accept or dismiss them
- 5. Publish to start tracking progress and get automated OKR dashboards

Tability will scan your OKRs and offer different suggestions to improve them. This can range from a small rewrite of a statement to make it clearer to a complete rewrite of the entire OKR.
Master Data OKRs examples
You will find in the next section many different Master Data Objectives and Key Results. We've included strategic initiatives in our templates to give you a better idea of the different between the key results (how we measure progress), and the initiatives (what we do to achieve the results).
Hope you'll find this helpful!
OKRs to establish robust Master Data needs for TM
ObjectiveEstablish robust Master Data needs for TM
KRIdentify 10 critical elements for TM's Master Data by Week 4
Research crucial components of TM's Master Data
Compile and categorize data elements by relevance
Finalize list of 10 critical elements by Week 4
KRTrain 80% of the relevant team on handling the Master Data by Week 12
Identify the team members who need Master Data training
Monitor and record training progress each week
Schedule Master Data training sessions by Week 6
KRImplement a system to maintain high-quality Master Data by Week 8
Design system for Master Data management by Week 5
Deploy and test the system by Week 7
Establish Master Data quality standards by Week 2
OKRs to master the fundamentals of data analysis
ObjectiveMaster the fundamentals of data analysis
KRScore 85% or above in all assessment tests of the data analysis course
Practice test questions regularly to assess understanding
Attend all tutoring sessions for additional help
Review course material daily to reinforce learned concepts
KRImplement 5 real-world projects using data analysis techniques learned
Prepare final report showcasing results achieved
Utilize acquired data analysis techniques for each project
Identify 5 real-world problems suitable for data analysis techniques
KRComplete 6 online course modules on data analysis by end of quarter
Finish studying all 6 course modules
Enroll in the data analysis online course
Schedule dedicated time weekly to study modules
OKRs to master fundamentals of Data Structures and Algorithms
ObjectiveMaster fundamentals of Data Structures and Algorithms
KRRead and summarize 3 books on advanced data structures and algorithms
Read each book thoroughly, highlighting important parts
Write summaries analyzing key concepts of each book
Purchase or borrow 3 books on advanced data structures and algorithms
KRComplete 10 online assignments on data structures with 90% accuracy
KRDevelop and successfully test 5 algorithms for complex mathematical problems
Implement and thoroughly test the devised algorithms
Develop unique algorithms to solve identified problems
Identify 5 complex mathematical problems requiring algorithms
OKRs to master the creation of pivot tables in Excel
ObjectiveMaster the creation of pivot tables in Excel
KRApply pivot tables in 2 real-world projects by week 6
Execute pivot tables in chosen projects
Learn the key functionalities of pivot tables
Select two relevant projects to implement pivot tables
KRComplete an online pivot table tutorial by week 4
Research and select a suitable online pivot table tutorial
Finish the entire tutorial by the end of week 4
Schedule daily time to complete the tutorial activities
KRAccurately analyze and present data using pivot tables by week 8
Practice data analysis using pivot tables from week 4-6
Prepare a pivot table presentation for week 8
Learn advanced features of pivot tables by week 3
OKRs to achieve mastery in advanced analytics tools
ObjectiveAchieve mastery in advanced analytics tools
KRComplete an advanced online course on SQL and Tableau by end of the quarter
Complete all assignments, quizzes, and final exam before the proposed deadline
Select and enroll in an advanced online course for SQL and Tableau
Dedicate specific hours daily for the coursework and adhere strictly to it
KRImplement 5 real-world projects using advanced analytics tools, achieving desired output
Develop and implement 5 analytics-based projects
Assess and ensure desired output is achieved
Select sophisticated analytics tools suitable for the projects
KRSolve 100 analytics problems using Python and R programming with 90% accuracy
Identify and start solving 100 analytics problems
Test and ensure 90% accuracy in problem-solving
Master Python and R programming through consistent practice and study
OKRs to master SQL and relational modeling to enhance data analysis skills
ObjectiveMaster SQL and relational modeling to enhance data analysis skills
KRSolve at least 20 complex SQL queries independently, demonstrating proficiency in query optimization
Continuously review and improve query execution plans for optimal efficiency
Utilize database indexes and appropriate joins to optimize query performance
Set aside regular time to practice writing complex SQL queries
Analyze and understand the data structure and relationships before writing queries
KRCollaborate with a SQL expert on a real-world project, effectively contributing to the data analysis process
KRComplete an online SQL course with a score of over 90% in all modules
Research and find a reputable online SQL course
Study consistently and complete all modules within the given timeframe
Review and revise any weak areas before taking each module's final assessment
Enroll in the selected SQL course and pay for it
KRSuccessfully design and implement a relational database schema for a small project
Implement and test the database schema, ensuring data integrity and performance
Understand the requirements and scope of the small project
Design the tables, attributes, and primary/foreign key relationships for the schema
Identify the entities and relationships to be represented in the database schema
Master Data OKR best practices
Generally speaking, your objectives should be ambitious yet achievable, and your key results should be measurable and time-bound (using the SMART framework can be helpful). It is also recommended to list strategic initiatives under your key results, as it'll help you avoid the common mistake of listing projects in your KRs.
Here are a couple of best practices extracted from our OKR implementation guide 👇
Tip #1: Limit the number of key results
Having too many OKRs is the #1 mistake that teams make when adopting the framework. The problem with tracking too many competing goals is that it will be hard for your team to know what really matters.
We recommend having 3-4 objectives, and 3-4 key results per objective. A platform like Tability can run audits on your data to help you identify the plans that have too many goals.
Tip #2: Commit to weekly OKR check-ins
Setting good goals can be challenging, but without regular check-ins, your team will struggle to make progress. We recommend that you track your OKRs weekly to get the full benefits from the framework.
Being able to see trends for your key results will also keep yourself honest.
Tip #3: No more than 2 yellow statuses in a row
Yes, this is another tip for goal-tracking instead of goal-setting (but you'll get plenty of OKR examples above). But, once you have your goals defined, it will be your ability to keep the right sense of urgency that will make the difference.
As a rule of thumb, it's best to avoid having more than 2 yellow/at risk statuses in a row.
Make a call on the 3rd update. You should be either back on track, or off track. This sounds harsh but it's the best way to signal risks early enough to fix things.
Save hours with automated Master Data OKR dashboards

The rules of OKRs are simple. Quarterly OKRs should be tracked weekly, and yearly OKRs should be tracked monthly. Reviewing progress periodically has several advantages:
- It brings the goals back to the top of the mind
- It will highlight poorly set OKRs
- It will surface execution risks
- It improves transparency and accountability
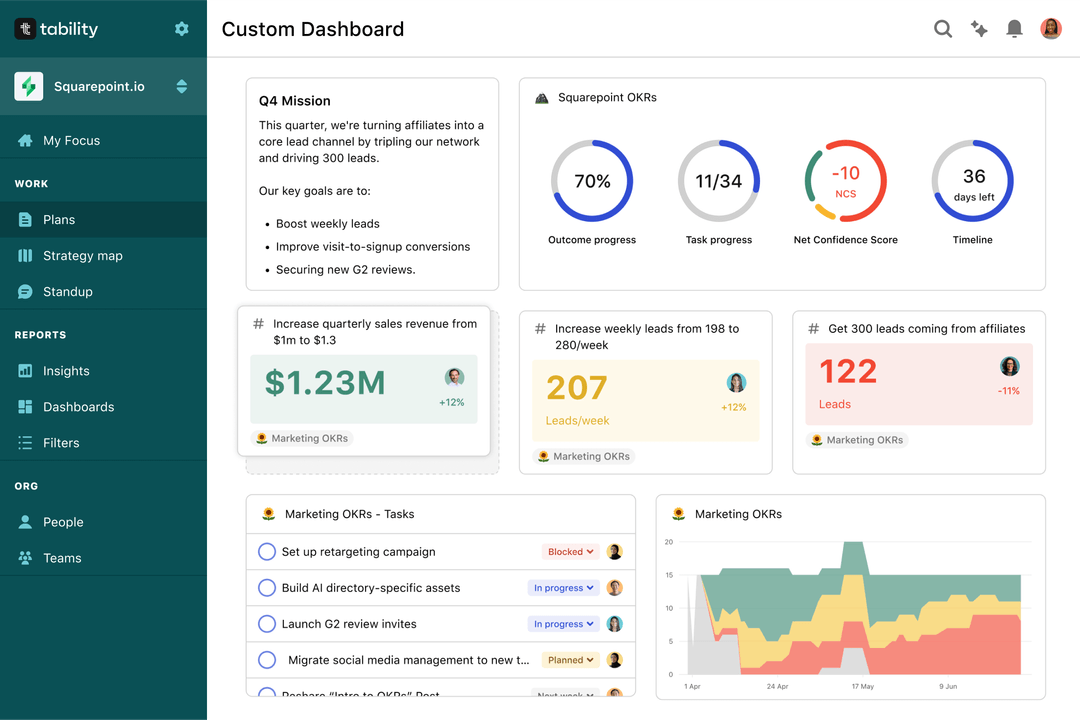
Most teams should start with a spreadsheet if they're using OKRs for the first time. Then, you can move to Tability to save time with automated OKR dashboards, data connectors, and actionable insights.
How to get Tability dashboards:
- 1. Create a Tability account
- 2. Use the importers to add your OKRs (works with any spreadsheet or doc)
- 3. Publish your OKR plan
That's it! Tability will instantly get access to 10+ dashboards to monitor progress, visualise trends, and identify risks early.
More Master Data OKR templates
We have more templates to help you draft your team goals and OKRs.
OKRs to implement effective project risk management strategies
OKRs to elevate productivity in academic research
OKRs to achieve proficiency as a middle level java developer
OKRs to foster user-centric culture through stakeholder engagement
OKRs to enhance customer service by reducing average response time
OKRs to successfully launch ATWOME's Injection Service in Florida