

Walk into any startup office or scale-up boardroom and you'll find one of two things on the wall. Either a faded printout of a business model canvas with sticky notes peeling off it, or a Miro board nobody has opened in six months. The canvas got filled in. Everyone agreed it was useful. Then it became wallpaper.
That's the gap between how the business model canvas is taught and how it's supposed to work. Most teams use it as a one-time deliverable. They run a two-hour offsite, fill in the nine boxes, take a photo, and consider the strategy done. Six months later, the company has shipped a different product to a different customer segment with a different revenue model, and nobody updated the canvas.
The business model canvas is not a deliverable. It's a hypothesis map. Each of the nine boxes is a bet you're making about your business, and the only way it stays useful is if you treat it like an operating artifact, not a poster. This guide walks through what the canvas is, what each block means, and how to turn it into something that actually drives strategy execution.
What the business model canvas actually is
The business model canvas is a one-page visual framework that maps how a company creates, delivers, and captures value. It was developed by Alexander Osterwalder and Yves Pigneur in 2005 and popularised by their 2010 book Business Model Generation. It's the most widely-used strategy tool in the world, sitting somewhere between a napkin sketch and a 50-page business plan.
The canvas has nine blocks, arranged so the right-hand side describes value (customers, channels, revenue) and the left-hand side describes infrastructure (resources, partners, costs). The value proposition sits in the middle, connecting the two halves. The whole point of the layout is that you can see, on one page, whether the economics actually hang together.
A well-used canvas answers four questions at a glance:
- Who are we serving and what problem are we solving for them?
- How do we reach them and keep the relationship going?
- What resources, activities, and partners make this possible?
- How does the money flow on both sides of the page?
When a strategy session ends with a leadership team still arguing about one of those four questions, you don't have a strategy. You have a list of disagreements. The canvas surfaces those disagreements early, on one page, before they become quarterly roadmap fights.
The nine building blocks, explained
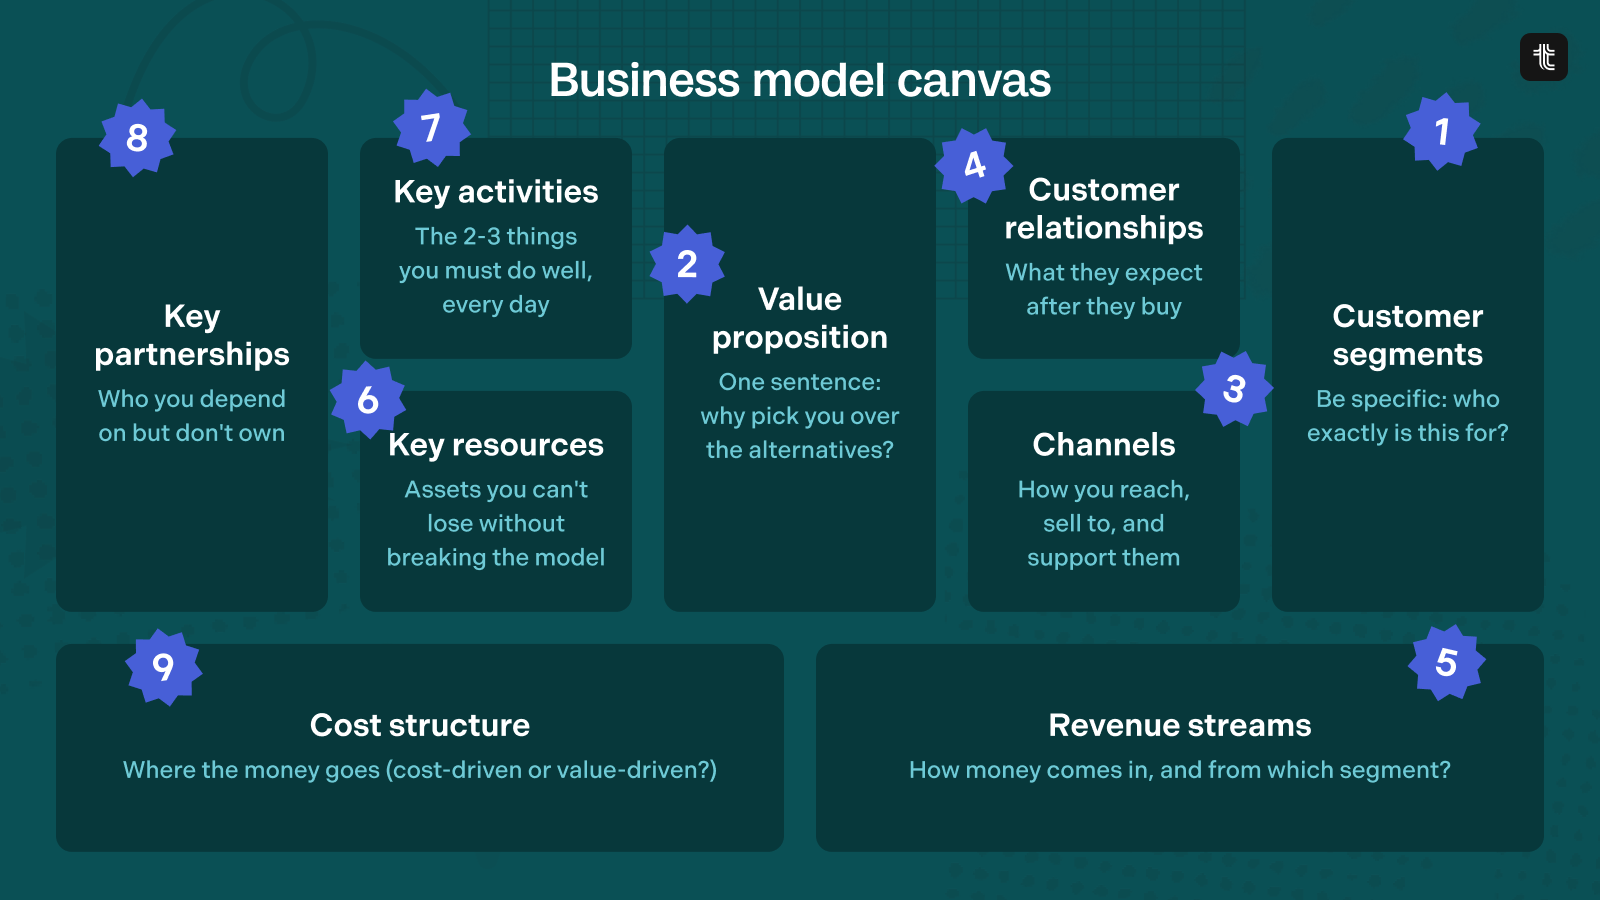
Every block is a hypothesis. That framing matters. You're not describing what is, you're articulating what you believe to be true and would need to validate.
1. Customer segments
Who exactly are you creating value for? The trap is being too broad. "Small businesses" is not a customer segment. "Series A SaaS companies in the US, 20 to 80 employees, with a hands-on founder running revenue" is. Segments should be specific enough that someone in marketing knows where to find them and someone in product knows what they want.
2. Value proposition
What job does your product do for that segment, and why is it better than the alternatives they already use? Most teams write a value proposition that describes what the product does. The version that wins describes the change in the customer's life. "Track OKRs" is a feature. "Know on Monday whether your quarter is on track" is a value proposition.
3. Channels
How does the value proposition reach the customer? This block covers everything from awareness to delivery to post-sale support. Direct sales, self-serve product-led growth, partner channels, app stores, content. The mistake is assuming one channel will do the whole job. In practice, you almost always need a stack.
4. Customer relationships
What kind of relationship does the segment expect, and what kind can you afford to provide? Self-service, automated, personal assistance, community, co-creation. The expensive part isn't choosing one. It's being honest about the cost-to-serve when your segment expects more than your pricing supports.
5. Revenue streams
How does the money come in, and from which segment? Subscription, transaction, licensing, advertising, usage-based, freemium upgrades. Most modern businesses run more than one stream, which is fine. What's not fine is having three revenue streams and only one of them actually paying the bills, and not knowing which one.
6. Key resources
What assets are required to make the model work? Physical, intellectual, human, financial. For a SaaS company this usually means engineering talent, the codebase itself, brand, and cash runway. The diagnostic question is: if we lost this resource, would the business still function? If the answer is no, it belongs here.
7. Key activities
What does the company actually have to do well, every day, to deliver the value proposition? Building product, running platforms, problem-solving for customers, growing a network. Most strategy mistakes show up here. A company will list ten activities and not be excellent at any of them. The canvas forces you to admit which three actually matter.
8. Key partnerships
Who do you depend on that you don't directly own? Suppliers, alliances, integration partners, co-marketing relationships. In SaaS this is increasingly about distribution: which integrations, marketplaces, or platforms expose you to your target segment? Pick the wrong partner and you've outsourced your channel without realising it.
9. Cost structure
Where does the money go, and is the model cost-driven (lean operations, low price) or value-driven (premium experience, willingness to spend)? Cross-reference this block with revenue streams. If your cost structure is value-driven and your revenue model is freemium, something has to give.
The mistake: treating the canvas as a deliverable
Here's the pattern. A leadership team blocks off a Friday afternoon, fills in the canvas in a workshop, takes a photo, and emails it out. Done. The canvas is now "the strategy" and gets quoted in board decks for the next year.
TLDR: don't do this. 🙅
The problem isn't the workshop. The problem is what happens after. A canvas filled in once is just a snapshot of your assumptions on a specific Friday. Markets shift. Customers churn for new reasons. Channel CAC creeps up. A partner you depended on changes their pricing. The canvas you printed in January describes a business that no longer exists by July.
To be frank, this is the same mistake teams make with strategy decks, annual planning, and any other "set it and forget it" artifact. The strategy work isn't the workshop. It's the operating cadence that updates the artifact when reality changes. This is exactly the territory StratOps covers: strategic operations is the function that keeps strategy and execution talking to each other, week after week, instead of letting them drift apart between offsites.
How to operationalise the business model canvas
If the canvas is a hypothesis map, the operating question is: who owns each hypothesis, what would prove or disprove it, and how often do we check in on it? Here's the four-step cadence we recommend.
Step 1: Assign an owner to every block
Each of the nine blocks gets a single accountable owner. Not a committee. Not a department. A name. In practice, customer segments and value proposition usually go to the head of product or CEO. Channels and customer relationships to marketing and sales leadership. Key resources, activities, and cost structure to operations or finance. Revenue streams to whoever owns commercial. Key partnerships to whoever is closest to the partner ecosystem, which varies.
Without an owner, blocks rot. Owners are what turn a poster into an operating document.
Step 2: Convert each block into testable assumptions
For every block, write down the two or three assumptions you're making and a metric that would tell you if the assumption is right. Examples:
- Customer segments: "Series A SaaS founders will pay for this" leads to metric: paid conversions from that segment.
- Channels: "Content will be our primary acquisition channel" leads to metric: percentage of pipeline sourced from organic.
- Revenue streams: "Self-serve will outpace sales-led at our price point" leads to metric: gross MRR from each motion.
Now the canvas isn't a poster. It's a list of bets with metrics attached. This is where the canvas plugs naturally into OKRs. Each block produces one or two key results. Quarterly OKRs become the way you test the canvas, not a parallel exercise.
Step 3: Run a weekly check-in on the riskiest blocks
Not every block needs weekly attention. Cost structure and key partnerships might be quarterly review items. But the blocks where you're actively unsure (usually customer segments, channels, and value proposition early on) need a weekly check-in. The owner of the block writes a short status: where the metric stands, what they learned this week, and what they're changing. Fifteen minutes per owner, max.
This is the part that fails when teams try to do it in spreadsheets and Slack. Without a shared place to write the update, the rhythm dies in three weeks. With one, it sticks.
Step 4: Refresh the canvas quarterly
Once a quarter, pull the canvas back out and update it based on what the weekly check-ins taught you. Move boxes around. Cross out assumptions that turned out to be wrong. Add new ones you've discovered. This is the moment most teams skip and it's the moment that decides whether the canvas is a strategic document or a fridge magnet.
Tie this to your strategic roadmap and quarterly planning so it doesn't feel like an extra ceremony. The canvas refresh is the front half of quarterly planning. By the time you're writing next quarter's strategic initiatives, you already know which blocks need investment and which blocks need a hard rethink.
Business model canvas vs lean canvas: which one should you use?
The lean canvas was adapted from the business model canvas by Ash Maurya in 2010, specifically for early-stage startups. Same one-page format, same nine-box layout, but four of the blocks are replaced. Key partners becomes problem. Key activities becomes solution. Key resources becomes key metrics. Customer relationships becomes unfair advantage.
The two canvases solve different problems:
The deeper point: a mature company will often run both. The business model canvas describes the core engine. A lean canvas might describe a new product line or market the company is testing inside that engine. Same artifact pattern, different scope.
Where Tability fits in the canvas workflow
The hardest part of operationalising the canvas isn't filling in the boxes. It's keeping the assumptions, owners, metrics, and weekly check-ins connected in one place. Most teams try to do this in a strategy doc, a spreadsheet of metrics, a project tracker, and an OKR tool, and the four artifacts drift apart within a month.
Tability is built for the workflow we described above. Each canvas block becomes an objective. Each testable assumption becomes a key result with an owner and a check-in cadence. Initiatives connect to the key results, so you can see whether the work you're actually doing is moving the assumptions you're actually trying to validate. When a check-in comes in red, the canvas owner knows before the quarterly review, not after.
Tools like Tability are specifically designed for this. They give strategy and ops teams a single place to track goals, run check-ins, and connect initiatives to outcomes, without the overhead of an enterprise platform. The canvas stays on the wall as a visual artifact. The operating layer underneath it stays live.
If you have a filled-in business model canvas and no idea what to do with it on Monday, that's the gap we built Tability to fill. Sign up free or book 30 minutes with us and we'll help you wire it up. Tability or not, you should still be checking in on it weekly.

.jpg)

.png)