.png)


.png)


Why use OKRs in Product?
Product teams can use OKRs to clearly define the outcomes they want to see at the end of the quarter. This, in turn, will make it much easier for people to pick the projects that will deliver the best impact. When you use OKRs, projects are no longer at the centre of your discussions. Instead, you put more emphasis on the goals, and projects are considered bets that can help you get there.
How to write OKRs for Product teams
Step 1. Understanding OKRs vs. Projects
Before jumping into the OKRs process, it is essential to understand the difference between Objectives, Key Results, and projects:
- Objectives: what do we want to achieve next quarter?
- Key Results: how are we going to measure progress?
- Projects/Initiatives: what are our best bets to get there?
Projects are mentioned here because a common mistake is to list them as Key Results. But a project is a deliverable (output), rather than a goal (outcome).
A good Objective should be inspiring and easy to understand by anyone in your org. You can be more specific in the Key Results, but the Objectives should give a clear idea of the expected impact at the end of the quarter.
A good Key Result should follow the rules of the SMART framework. In particular, it should be relevant to its parent Objective, measurable through the quarter, and time-bound. A good test is to ask, "would we do things differently if this KR goes off-track?". If the answer is negative, then you need to refine your OKR.
Finally, your projects are the things that will move the needle on your Key Results. They're bets that you make with the team. Some will work—double down on it. Some will fail, and it should be okay to stop and move on to the next idea.
Step 2. Pick 2-3 focus areas
The next step is to pick the right focus. One tool that can help here is the AARRR framework which divides your customer's journey into 5 stages:
- Acquisition: how many people find out that you exist?
- Activation: how many of them sign up for your product and become leads?
- Retention: how many leads come back to use your product again?
- Referral: how many users share your product with others?
- Revenues: how many users end up paying for your product?
A Product team mostly looks after 2 things. They make sure that new users can get up & running quickly (Activation), and they make sure that customers find value in the product and keep using it (Retention).
You can use these 2 themes as a starting point for your Objectives, and then derive the corresponding Key Results.
Step 3. Write your plan
Once you've narrowed your focus, you can start writing your OKRs.
Agree on 2-3 Objectives before diving into the Key Results. You'll see some examples below, and here's a guide about writing OKRs if you're just getting started.
Example of Product OKRs
OKRs to achieve Product-Market fit
We have achieved Product-Market fit
Get a 40% score on the Product-Market fit survey
45% of new users are still active after 8 weeks
We've increased demand to get 100 new leads every week
OKRs to build a successful MVP
Launch a successful MVP
Increase number of weekly active users (WAUs) from 15 to 100
Maintain a Net Promoter Score (NPS) abover 40
Secure 5 paid customers before GA launch
OKRs to improve product integrations
Enhance product integration capabilities
Increase the number of supported integrations by 50%
Achieve an average customer rating of 4.5 out of 5 for integrations
Establish partnerships with at least three key industry platforms
OKRs to optimize product pricing
Optimize product pricing and monetization strategies
Design new pricing model that results in a 15% increase in average revenue per user (ARPU)
Get 10% MRR increase via upsell/cross-sell campaigns
Migrate 10% of customers to the new pricing model
OKRs to build an amazing user experience
Significantly improve the end-user experience
Double NPS from 30 to 60
Improve week-4 retention of new users from 30% to 45%
Boost user happiness by implementing the equivalent of 100 votes on feature requests
OKRs to improve self-serve onboarding
Our users can onboard the product with success
70% of leads complete their activation process on day 1
Get 80% satisfaction on onboarding feedback survey
We have 10 tutorials covering core parts of the product
Discovering more Software Development OKRs
There are a couple of ways for you to get more examples of OKRs that would be a great fit for Dev teams:
- OKRs templates for devs: this is a library of 150+ OKRs templates that you can search by keywords or tags.
- AI OKRs generator: you can also generate a tailored set of goals using AI.
Tracking your OKRs
Knowing how to write good OKRs is critical, but without good tracking in place, the OKRs will fade away and focus will be lost.
The easier it is for a team to have weekly discussions around the OKRs, the better they'll execute. Here are a few best practices for tracking OKRs.
1. Do weekly check-ins
Quarterly OKRs should be tracked every week to be effective. Without a continuous reflection on progress, your OKRs won't be much different from having KPIs.
The check-ins process can be automated with a platform like Tability that takes care of reminders, and distribute updates to the teams.
2. Keep track of your confidence
Good progress updates should help everyone understand how far we are from our goal, but also how confident we are in achieving it. You can use a simple red/yellow/green color coding to indicate your confidence.
3. Make trends easy to see
Lastly, it's important to look at trends to avoid false positives. It's not rare for a team to have a hot start and then slow down mid quarter. This will be hard to see unless you can look at progress trends for individual Key Results.
What other Product metrics can you use?
Now that you've got good Objectives, it's time to pick some key results and finding good metrics that work for your team can be tricky. Lucky for you, we've laid out all the best Product success metrics to use.
Here are a few to get you started:
Net Promoter Score (NPS)
NPS is seen as a general indicator of happiness for your customers. It measures how likely your users are to recommend your product.
Product/Market Fit score
The Product/Market Fit survey asks your user how disappointed they would be if your service no longer existed.
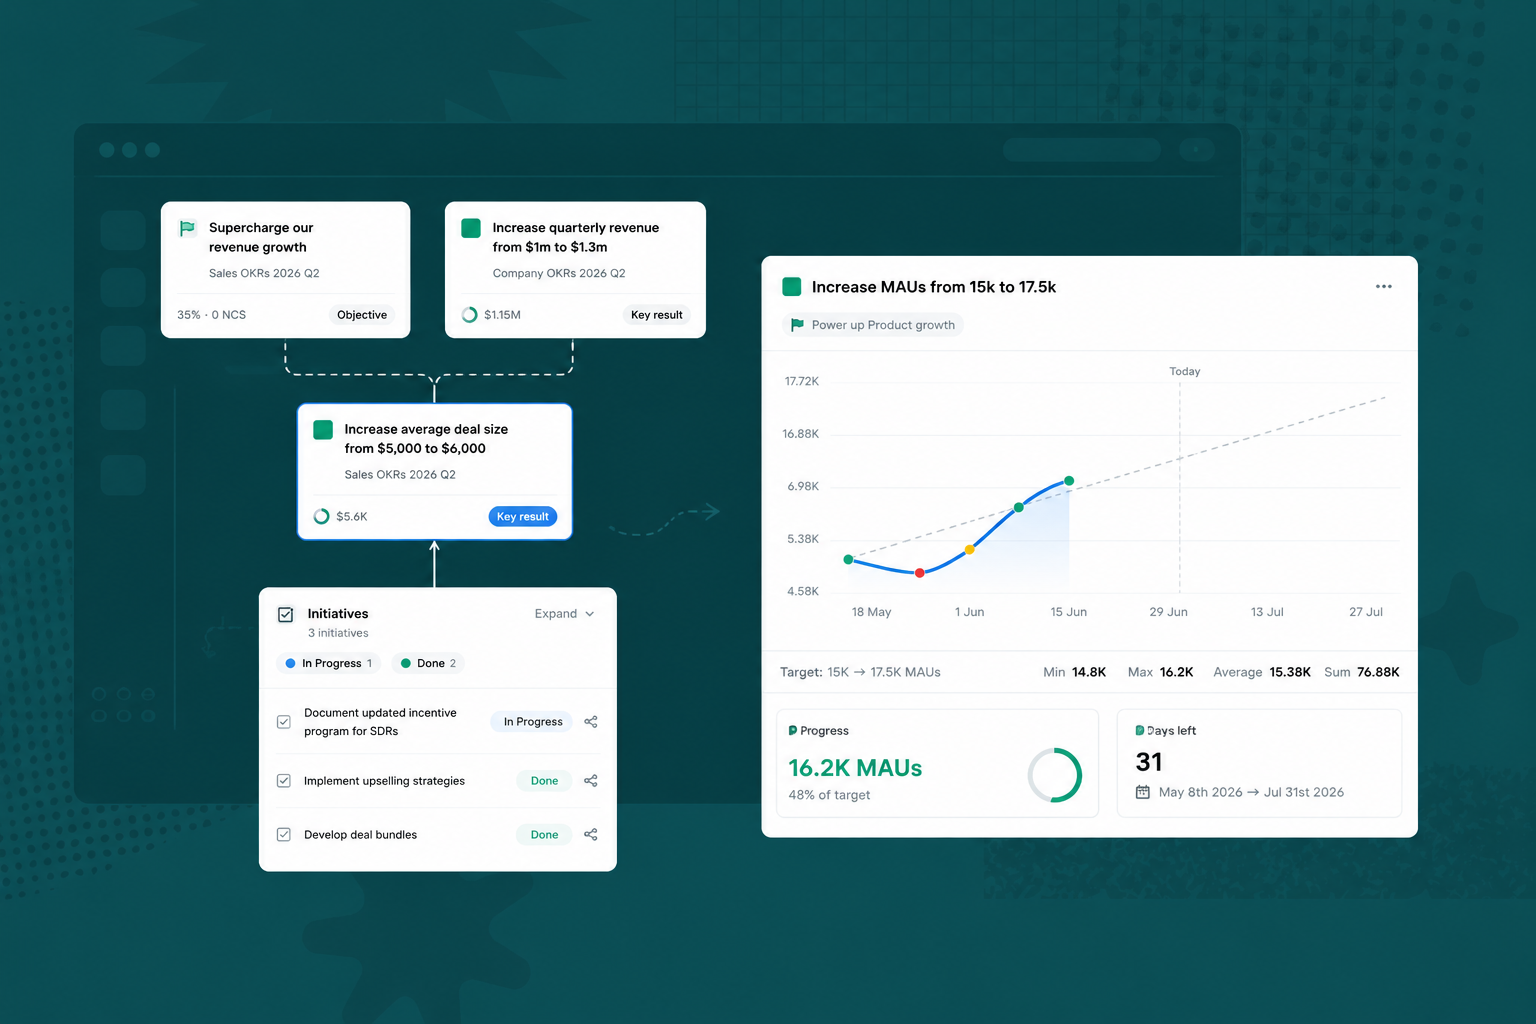
Daily/Weekly/Monthly Active Users (DAUs, WAUs, MAUs)
How many people are using your product every day/week/month.
Retention rate
What's the percentage of users that come back to your product every day/week/month.
Churn
The opposite of retention. What's the percentage of users that stop using your product.
Virality
How many people are recommending your product to their friends or colleague.
Engagement
How do people interact with your content (it can be anything, from visits to specific sections to conversations in Intercom…)
Conversion rate
How many signups turn into active customers.