.jpg)
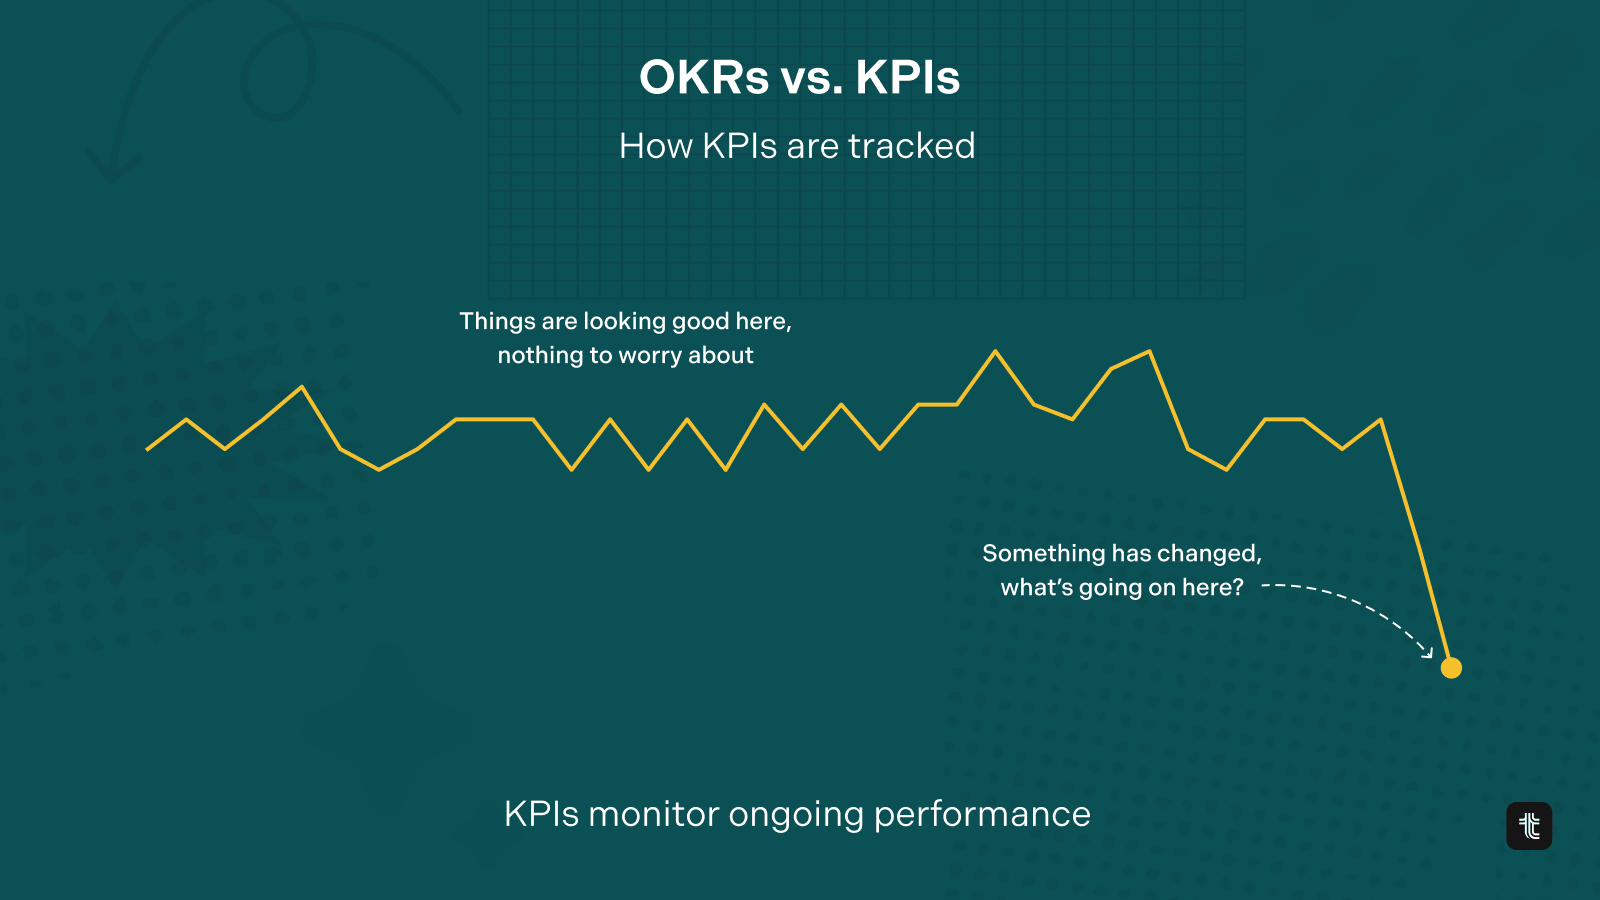
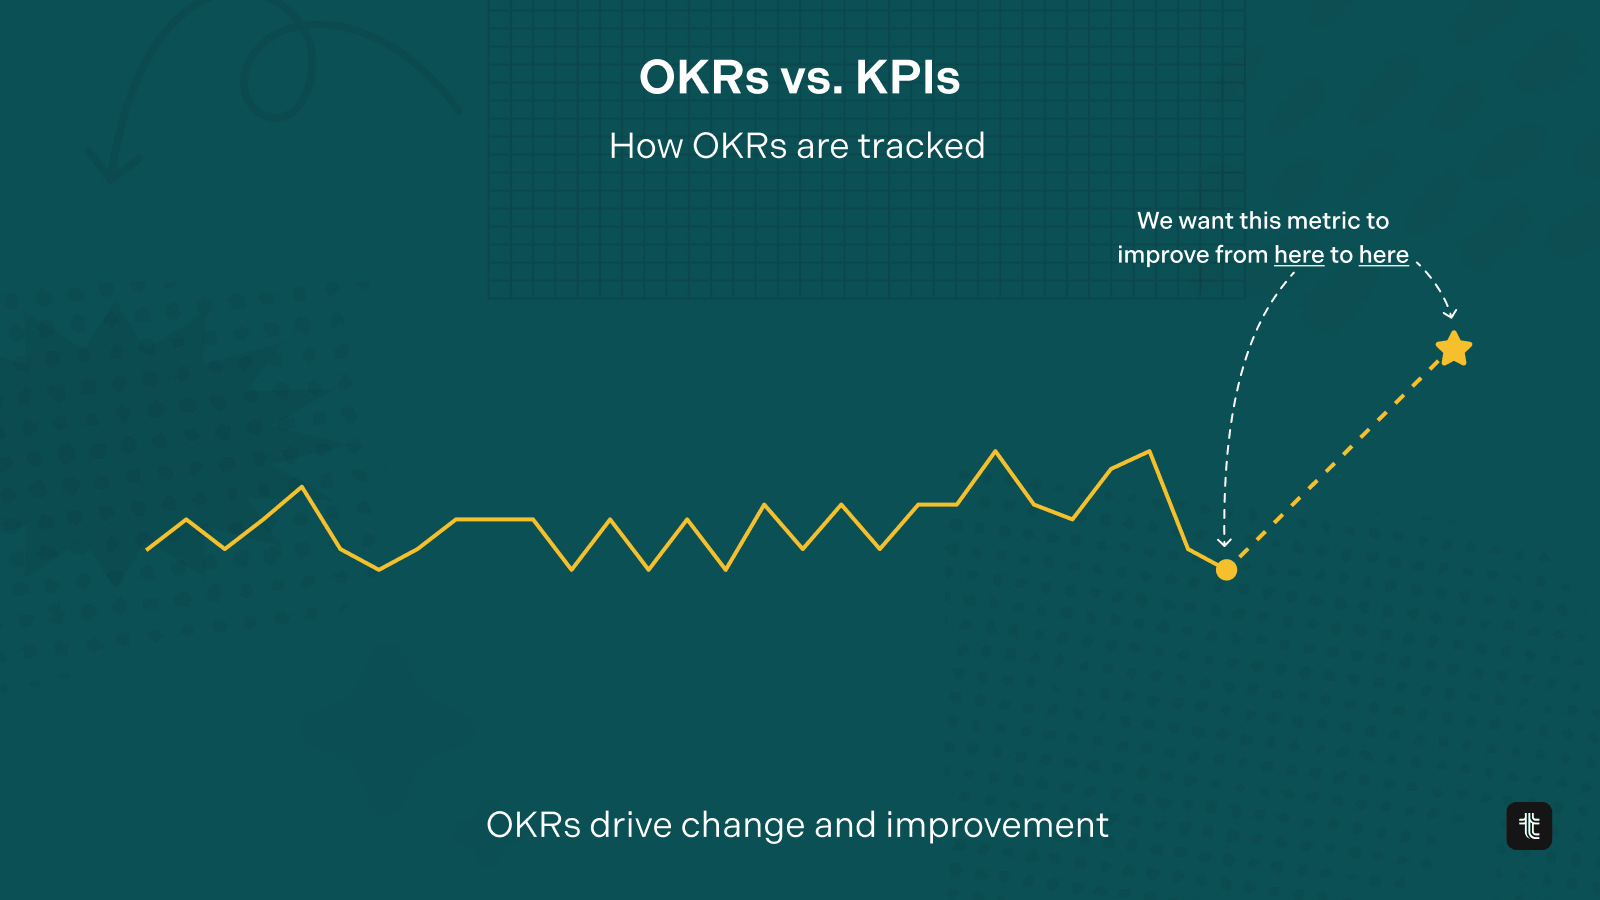
OKRs and KPIs are both measurement tools, but they serve completely different purposes. A KPI (Key Performance Indicator) monitors the ongoing health of your business — it tells you if things are working. An OKR (Objective and Key Result) drives change — it sets a specific ambitious outcome you want to achieve in the next 90 days. Most high-performing teams use both.
Objectives and Key Results (OKRs) have become an increasingly popular framework for setting goals and measuring progress over the last five years. However, there is still some confusion about what exactly OKRs are meant to accomplish, especially when compared to other performance metrics like Key Performance Indicators (KPIs).
In this post, we’ll take an in-depth look at OKRs, KPIs and their differences.
What is a KPI?
A KPI is an acronym that stands for Key Performance Indicator. It is a metric that helps evaluate the success of an org, team, or project for a particular activity. There's an unlimited amount of KPIs available, and they will highly depend on the context in which they are used.

KPIs should be limited by definition. You need to focus on the 5-10 key metrics that best represent success for the activity that is monitored. KPIs do not have targets, but there should be thresholds that trigger alerts. For instance, a sudden drop in the volume of leads should probably trigger a meeting to address that issue, and redirect resources if needed.
KPIs do not have target associated, but if they do, they'll often be referred as success metrics: the combination of a KPIs + the target that defines success.
What are KPI examples?
Most companies will have a set of KPIs at the top that reflects their growth funnel. Here are some classic examples of KPIs in business.
- Revenue
- Number of leads
- Number of customers
- Churn
- Burn
But, you can also be more specific at a team or project level. For instance, a team in charge of application performance might have the following set of KPIs:
- Page load time
- Apdex
- Memory Load
- Cost per transaction
For a complete list of KPIs, you can check our list of 100+ KPI and success metrics examples and you'll find a selection of KPIs below.
Sales KPI examples
- Monthly Recurring Revenue (MRR) - Measures monthly sales from ongoing subscriptions
- Sales Qualified Leads (SQLs) - Tracks number of sales ready leads passed to sales team
- Sales Cycle Length - Calculates average time from initial contact to closed deal
- Win Rate - Percentage of quoted deals that are won
- Customer Acquisition Cost - Costs involved per new customer obtained
Marketing KPI examples
- Site Traffic - Volume of visitors to company site over time
- Bounce Rate - Percentage leaving site after only viewing one page
- Email Open Rate - Percentage of emails sent that are opened by recipients
- Cost Per Lead - Marketing spend required to generate a sales lead
- Social Media Engagement - Likes, clicks, shares, comments on social posts
Customer Support KPI examples
- First Contact Resolution - Percentage of inquiries resolved in first interaction
- Customer Satisfaction Score (CSAT) - Survey feedback rating from customers
- Wait Time - Average time customer waits to have inquiry addressed
- Calls Handled per Agent - Daily average calls per service team member
- Escalations - Percentage of issues needing management involvement
Product KPI examples
- Active Users - Number of customers actively using product in set time period
- Churn Rate - Percentage of customers ending subscriptions in time frame
- Adoption Rate - Speed at which new features are used after launches
- Uptime - Percentage of time platform is accessible without downtime
- Defect Density - Bugs discovered divided by lines of code
Finance KPIs
- Cash Flow - Net cash generated from business operations
- Burn Rate - Speed at which available cash is spent per month
- Operating Costs - Overhead costs involved in running operations
- Gross Margin - Profitability after accounting for production costs
- Working Capital - Cash available to fund business expenses
How do you create KPIs?
KPIs are created by starting with a project, team or business, and then levelling up to identify metrics that are best correlated to performance. A simple test for whether or not a KPI is effective is to ask yourself this question:
Would we change what we're doing if <metric> goes down?
If the answer is no, then you are probably not looking at a critical metric for that system. But if the answer is a resounding "yes", then you're most certainly looking at a KPI.
KPIs should also stay fairly stable over time, and it's quite common to keep the same KPIs around for years.
What is an OKR?
OKRs is an acronym that stands for Objectives and Key Results. It is a complete goal-setting framework that helps organizations set clear goals to achieve annually or quarterly. OKR history is traced back to it's introduction in the 70s at Intel by Andy Grove, and then got popular after Google adopted it to drive their effort.
What used to be a goal-setting framework for Enterprise is now being used by teams of all sizes. It has become the go-to goal-setting framework and a way to align corporate level strategy with team execution.
OKRs are divided into 2 components:
- Objectives: they're qualitative statements that describe what we want to change by the end of the quarter.
- Key Results: they're quantitative statements that define how success will be measured for the Objectives.

OKRs can be seen as a quarterly North Star that defines a specific set of outcomes to achieve. They will change from one quarter to another, but they have a huge impact on the roadmap during the quarter.
What are OKR examples?
OKRs can be applied to any kind of theme that a team wants to focus on. They may use the same metrics as your KPIs, but they provide context around it. Below is an example that illustrate the different approach that you take when writing a set of KPIs vs writing a complete OKRs for the same business domain.

Here's an example of OKRs for SEO
- Objective: Become the #1 online resource for the problem we solve
- Key Result 1: Secure 45 high-quality backlinks from industry influences and publications
- Key Result 2: Get 30% more organic visits to our online resources
- Key Result 3: We rank in top 5 results for 60% of our targeted keywords in Google
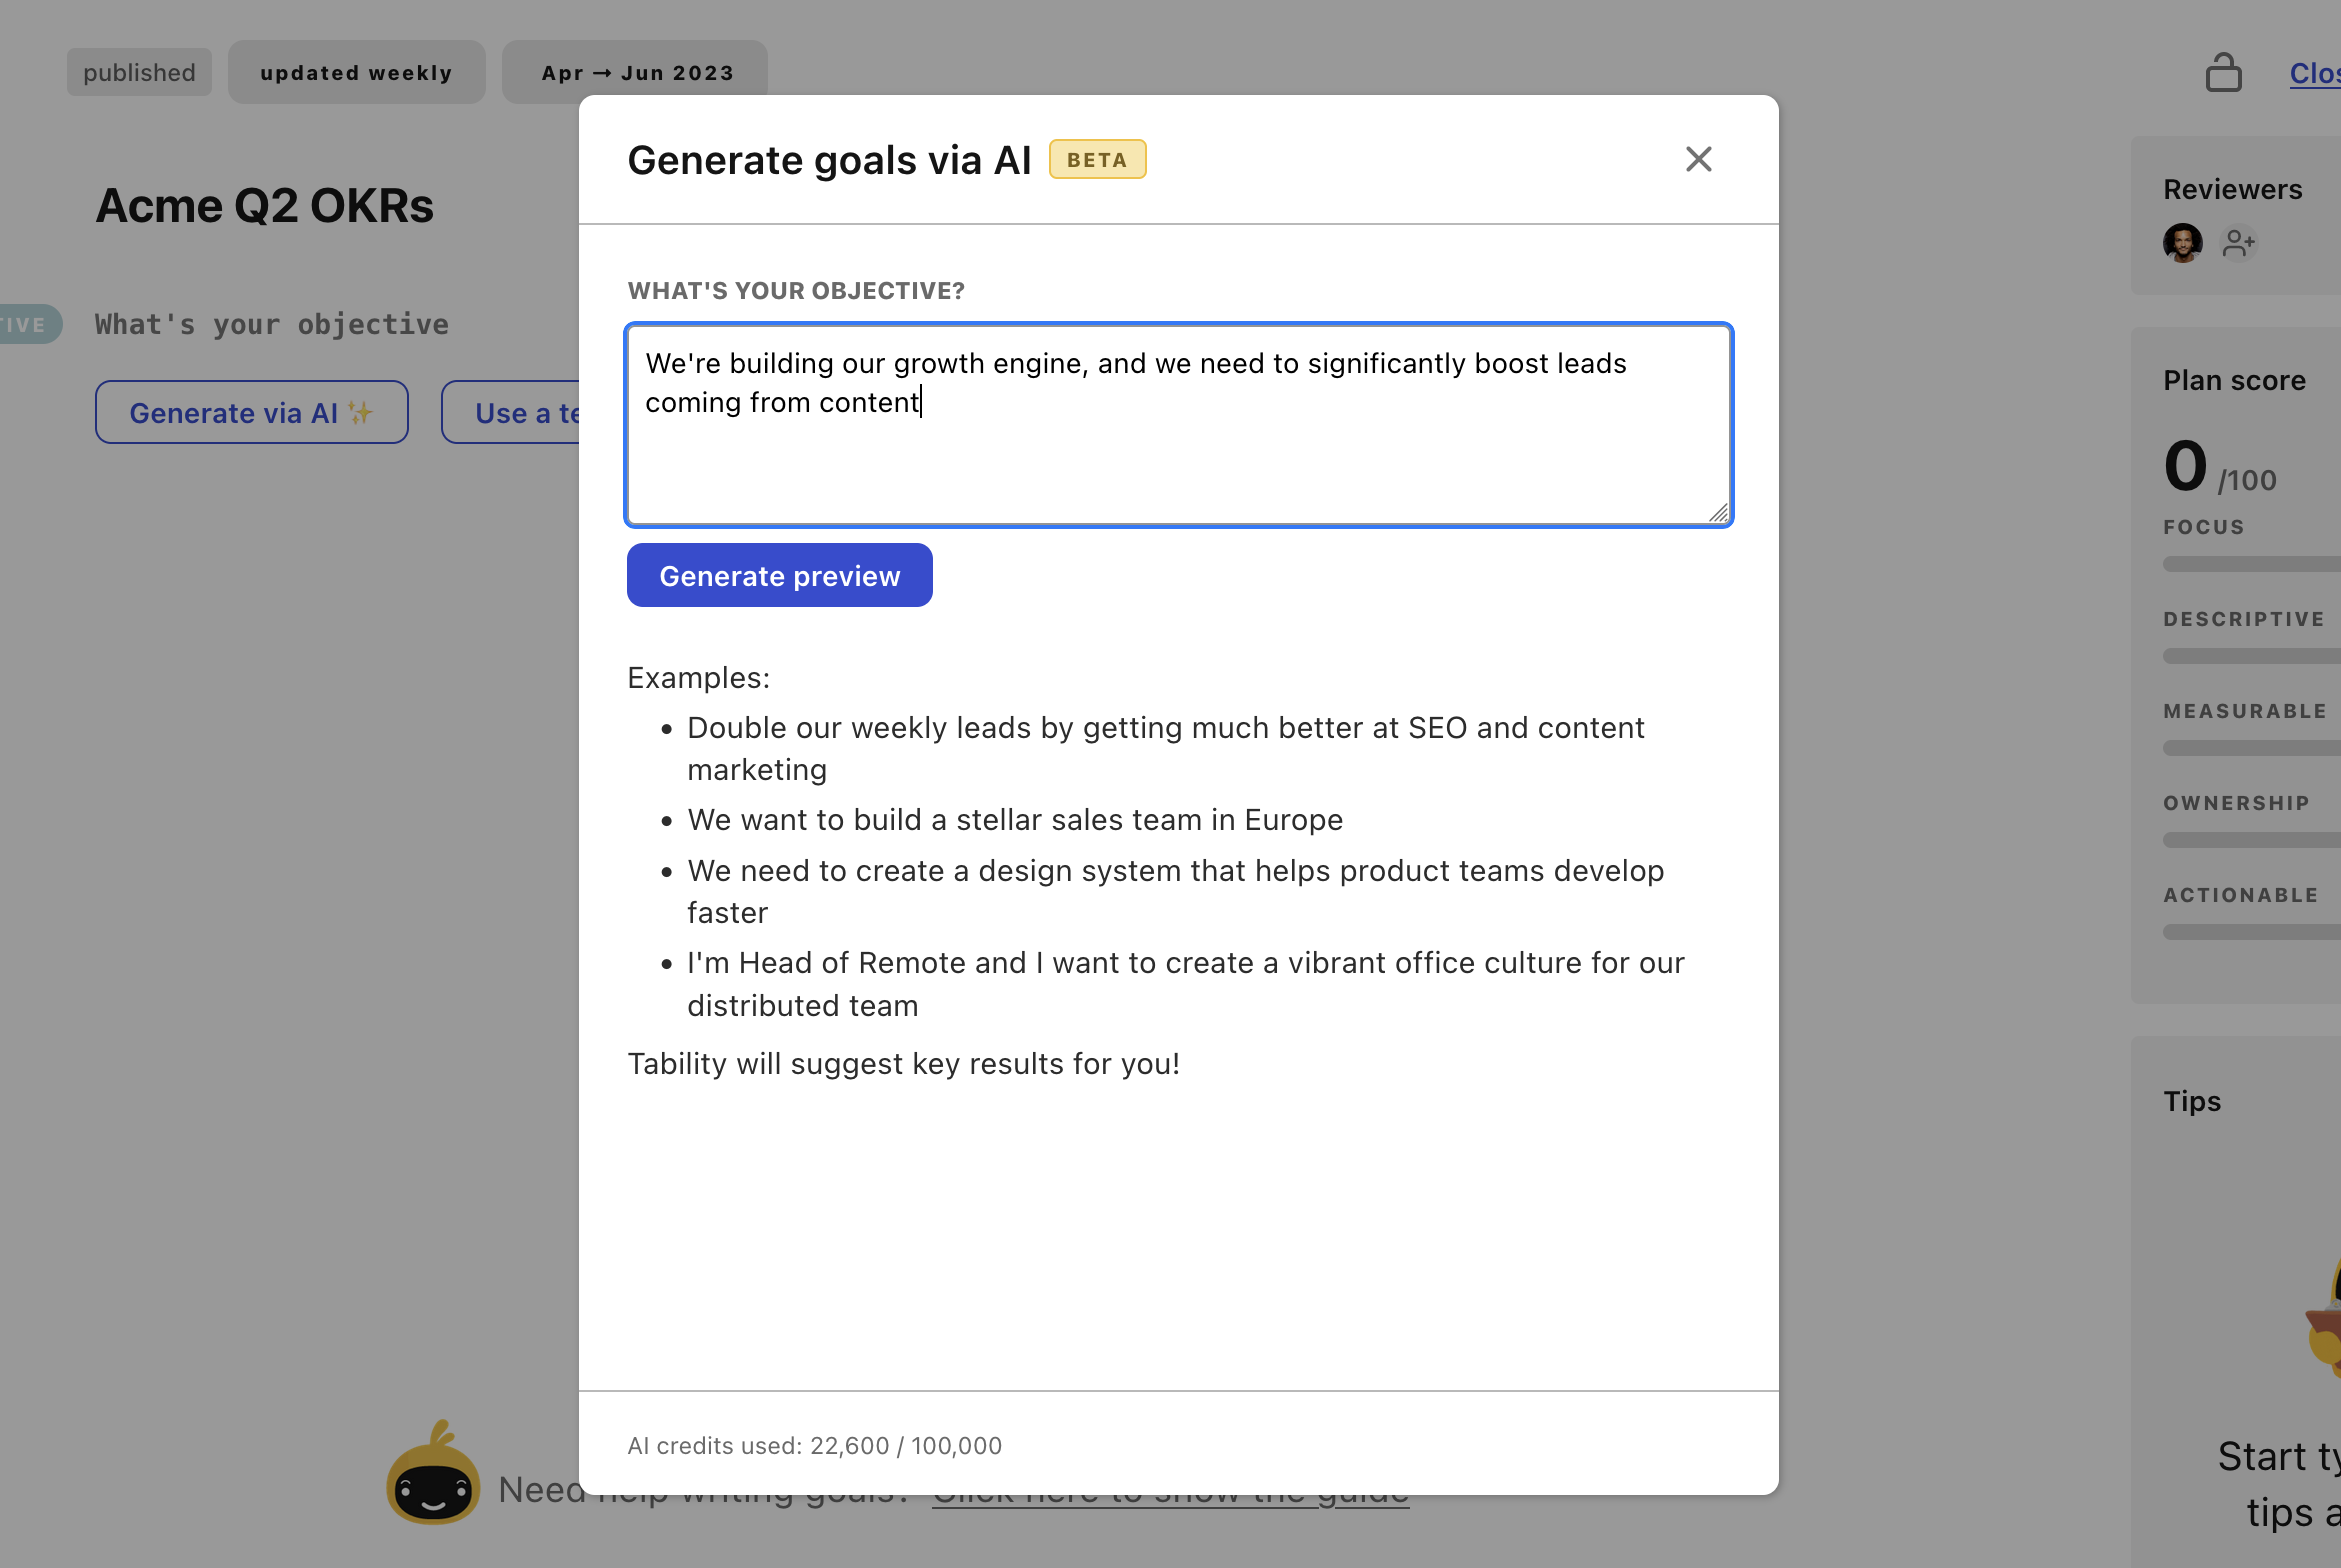
Here's an example of OKRs for Content Marketing
- Objective: Content is a significant driver for growth
- Key Result 1: 20 partners have joined our content partner program
- Key Result 2: Increase traffic to our blog to 3k visits/week
- Key Result 3: Increase content-to-lead conversion to 9%
Some more examples are listed below.
Sales OKR example
Objective: Expand enterprise customer success
Key Results:
- Onboard 5 new Fortune 500 logos
- Achieve 130% booked revenue renewal rate
- Maintain 98% customer retention rate
Product OKR example
Objective: Launch self-service user analytics
Key Results:
- Ship beta analytics dashboard by mid-quarter
- Document analytics methodology and best practices
- Gain user adoption with 50% MAU
Finance OKR example
Objective: Manage cash flow for growth goals
Key Results:
- Extend runway by raising $10M in capital
- Keep burn rate under $3M per quarter
- Reduce days sales outstanding below 30 days
Check out our list of OKR examples by function to learn more.
How do you create OKRs?
OKRs start with a vision. You often start by deciding on specific themes that you want to address. A simple approach is to look at the AARRR funnel, and pick one or two parts of the funnel that you want to improve.
Once you have a general idea of your desired outcomes (customer retention, leads conversion, attack a new market...), you can turn them into an inspiring Objective and list the associated Key Results.
You'll repeat that process at the end of every quarter to start a new OKRs cycle.
If you want to go faster, you can also leverage a goal-setting AI to get a draft of your OKRs in seconds.
OKRs meaning vs. KPIs meaning
KPIs are mainly used as a monitoring tool to ensure that operations are working smoothly. They help you understand the current state of the business and can be referred to during planning sessions to identify areas of improvement.

KPIs aren't used to drive the roadmap, but they can cause a team to change their plans if there's a sudden negative change in performance. Teams will generally use a spreadsheet to track KPIs as they just need to keep track of the evolution of the metrics.
OKRs, on the other hand, will have a significant impact on the roadmap. They can be seen as the North Star that will align and guide everyone for a set number of months. OKRs are much more collaborative, and there should be a weekly discussion on progress – as such, it is best to use a proper OKRs-tracking solution to keep track of the conversations around the goals.
Key differences between OKRs and KPIs

- KPIs are a simple set of metrics, OKRs have both a descriptive and measurable aspect.
- KPIs are mainly a reporting activity, OKRs include feedback and conversations around goals.
- KPIs can stay the same for years, OKRs change every quarter.
- KPIs monitor the performance of existing activities, OKRs drive efforts to set new performance baselines for existing activities.
- OKRs have a continuous impact on the roadmap, KPIs will alter roadmap efforts only if there's a drop in performance.
The core meaning of OKRs is alignment, while the core meaning of KPIs is monitoring.
Can OKRs replace KPIs?
Yes, you can absolutely use OKRs and KPIs together as they have different roles. Your KPIs should be used to monitor the ongoing stability of your business, and trigger alerts whenever you see an unexpected dip in performance.
OKRs should not replace KPIs. Think of KPIs as the dashboard of your car — always on, always monitoring. OKRs are the destination you've set in the sat-nav this quarter. You need both. Your KPIs will tell you if something breaks; your OKRs tell you where you're going.
Your OKRs will align teams toward a specific set of outcomes, which will generally result in improving a certain number of KPIs.
.png)

.jpg)