Most teams meet value chain analysis in a strategy class, draw a horizontal flow of arrows on a whiteboard, and then never use it again. Which is a shame, because the underlying idea is genuinely useful. Strip away the textbook framing and a value chain is just an honest answer to one question: where in the work we do does value actually get created, and where is it leaking?
The version that gets taught is Michael Porter’s 1985 model: nine activities split into five primary and four support, each one analysed for cost and differentiation. That framework is still useful as a checklist. The problem is that most teams stop at the checklist. They produce a tidy diagram, hand it to leadership, and never use it to change a decision. The diagram lives in a deck. The decisions live somewhere else.
This guide walks through the model, but the real point is the bit most articles skip: how to take the output of a value chain analysis and convert it into prioritised initiatives that your operating cadence will actually follow through on. If you map the chain and stop there, you have done arts and crafts. If you map the chain and connect each gap to a quarterly outcome with a weekly check-in, you have done strategy.
What value chain analysis actually is
Value chain analysis is a method for breaking your business into the discrete activities that produce value, then examining each activity to see where you have margin to capture, costs to cut, or a differentiation advantage to press. The output is a prioritised list of places to invest, defend, or stop investing.
Porter’s original model splits the chain into two layers:
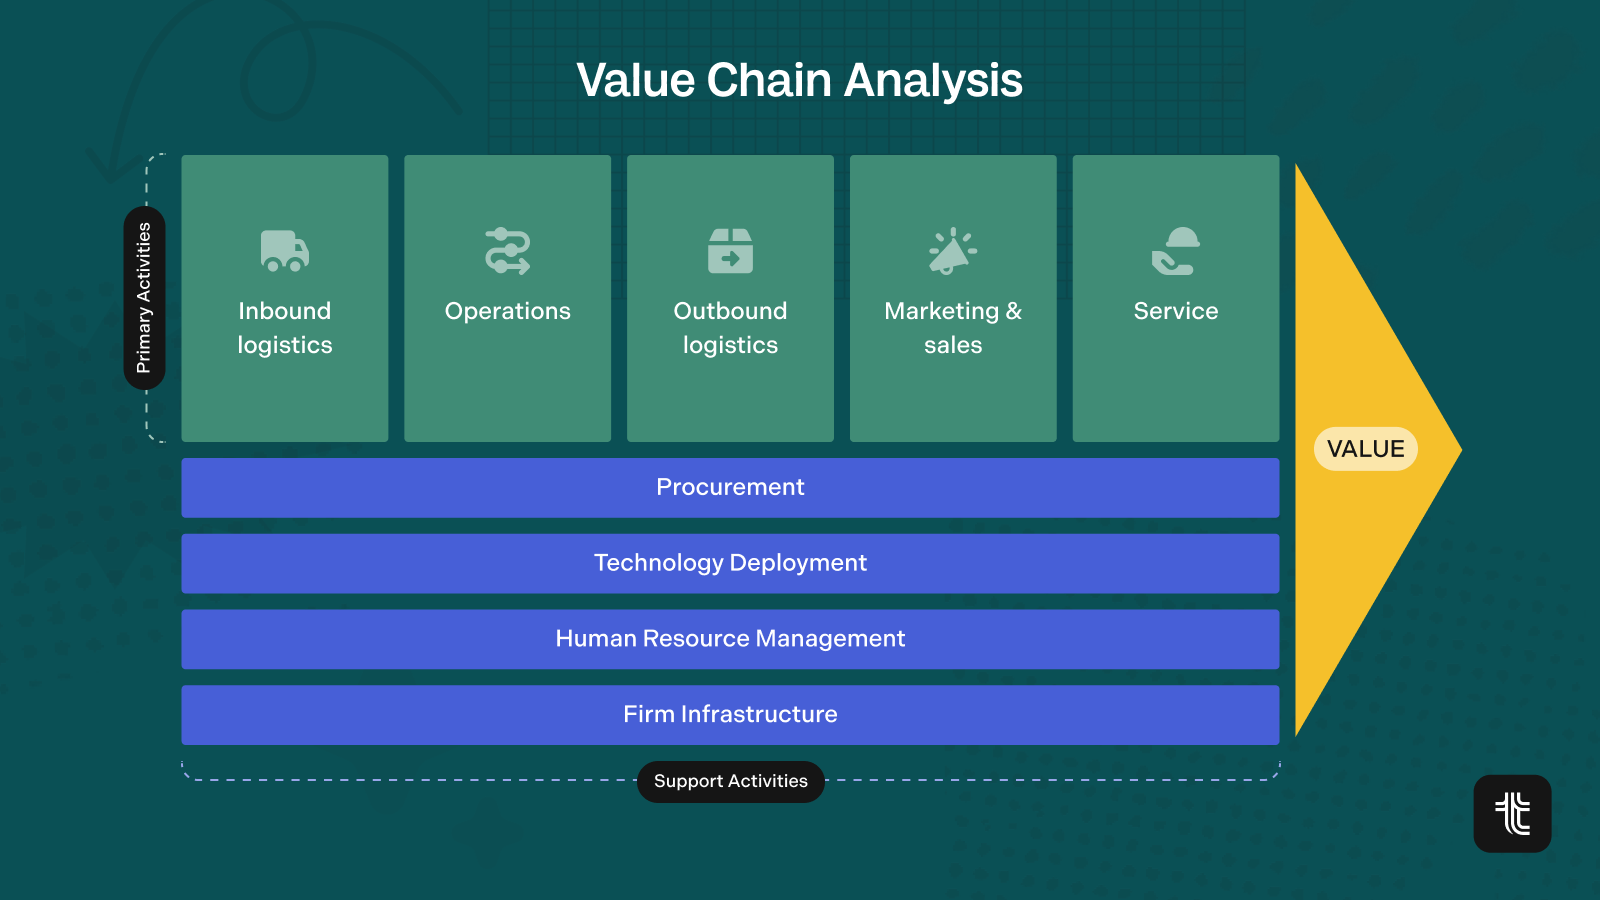
Primary activities are the things that directly touch the product or the customer.
- Inbound logistics: receiving, storing, and distributing inputs.
- Operations: turning inputs into the finished product or service.
- Outbound logistics: getting the finished thing to the customer.
- Marketing and sales: making the buyer aware and getting them to choose you.
- Service: maintaining the value of the product after the sale.
Support activities keep the primary activities running.
- Firm infrastructure: finance, legal, planning, the general management layer.
- Human resources: hiring, retaining, developing the people doing the primary work.
- Technology: the tools and systems that make the primary activities better, faster, or cheaper.
- Procurement: how you source the inputs into the chain.
The argument behind the model is that competitive advantage does not come from the business as a whole. It comes from one or two activities in the chain that you do measurably better, or measurably cheaper, than anyone else. Everything else can be solid and average. The trick is identifying which activities matter.
💡 Related: What is operational excellence?
Why most value chain analyses fail
In practice, the typical value chain analysis fails for the same handful of reasons. They are not theoretical. They show up every time a team tries this in a real planning week.
1. The chain becomes a process map. Teams default to drawing what they do in sequence rather than analysing where value is added. A process map tells you the order of strategic operations. A value chain tells you the margin at each step. Those are different artefacts and they answer different questions.
2. No costs get attached. A value chain without numbers is opinion. If you cannot say roughly what each activity costs and roughly what it contributes to revenue or differentiation, the analysis is decorative. You do not need precise allocation. You need directionally honest figures.
3. The output is never re-opened. The diagram lands in a strategy deck and that is the last anyone sees of it. Three months later, when the team is arguing about which initiatives to fund, nobody pulls the value chain back out. That is the test of whether the analysis was real: does it shape the next quarter’s decisions, or not?
4. Support activities get ignored. Most teams over-index on the primary activities and under-invest in the support layer. But every long-running competitive advantage in software is built on a support activity. Engineering productivity. Hiring quality. Data infrastructure. The support activities are where most of the compounding lives.
A five-step value chain analysis that actually changes decisions
The version below is built to produce a prioritised initiative list, not a poster. If you finish the five steps and you do not have three to five things you are going to do differently next quarter, the analysis was not real.
Step 1. Define what you mean by value
Before mapping anything, write a single sentence that finishes: “In this business, value is created when ____.” For a SaaS company that might be “when a customer reaches their planning rhythm and renews.” For a logistics company it might be “when a parcel arrives on time and undamaged.” The sentence is the bar. Every activity in the chain gets judged against it.
Step 2. List the activities, primary and support
Use Porter’s nine activities as a starting prompt, but do not be precious. Most modern businesses are not manufacturing companies and the nine boxes do not always map cleanly. Adapt the labels. A B2B SaaS chain might replace inbound and outbound logistics with onboarding and lifecycle. The point is to capture the full set of activities, not to honour the original model.
For each activity, write a one-line description of what actually happens. Resist the urge to write what you wish happened. The whole exercise depends on being honest about the current state.
Step 3. Estimate cost and contribution for each activity
For each activity, fill in three things.
- Approximate annual cost. Headcount, tools, vendors. Round generously.
- Contribution to value. Use a 1 to 5 scale tied back to your sentence from Step 1.
- Differentiation strength. Are we measurably better, the same as, or worse than the people we lose deals to?
You are looking for two things. Activities where the cost is high and contribution is low, those are candidates to compress. Activities where contribution is high and differentiation is weak, those are candidates to invest in. The rest can stay where they are.
Step 4. Identify two to three structural moves
A value chain analysis is not useful at the activity level. It is useful at the structural level. After Step 3 you should be able to write two or three statements like:
- We are over-investing in marketing relative to its current contribution. Cap it for two quarters.
- Our onboarding is contributing more value than we resource it for. Double the headcount and rebuild the playbook.
- Our pricing operations are at parity with the market. We have no advantage there. Stop trying to differentiate on it.
Each of those is a real decision. Each one will be uncomfortable for someone in the room. That is the signal you have done the work properly. If every move is comfortable, you are not changing anything.
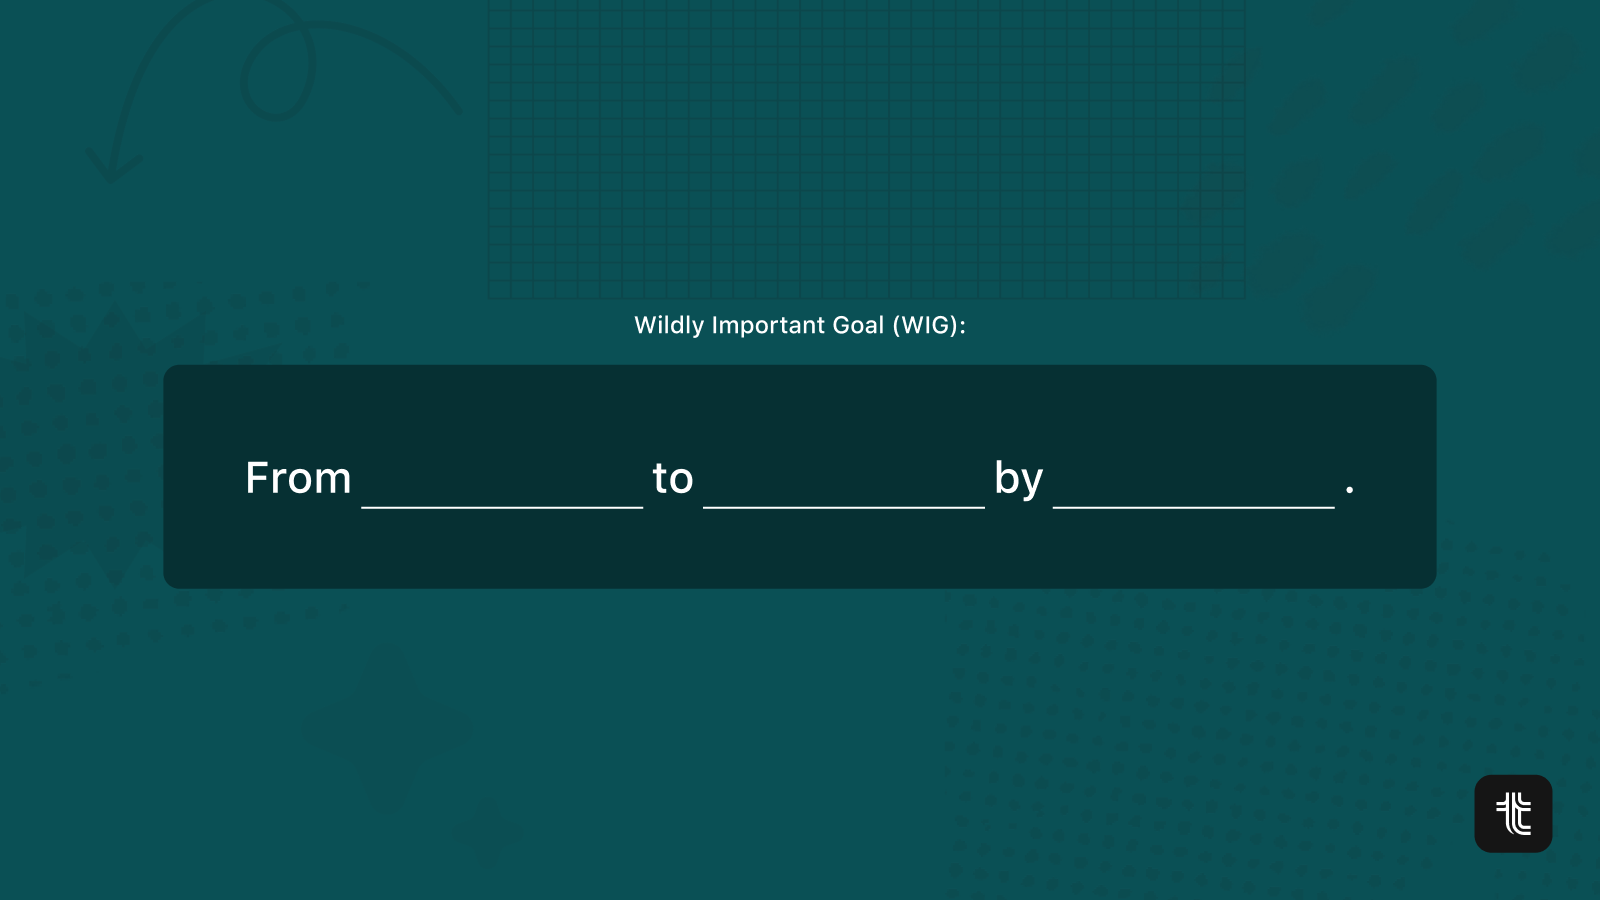
Step 5. Convert the moves into outcomes
This is the step almost nobody does, and it is the one that makes the analysis worth the time. Each structural move from Step 4 becomes a measurable outcome with an owner, a target, and a check-in cadence. “Double onboarding headcount” is a task. “Reduce time-to-first-value from 14 days to 5 days by end of Q3” is an outcome. The first is busy work. The second is a strategy.
If you run on OKRs, this is where the value chain output meets your planning artefact. Each move becomes an objective or key result. If you do not run on OKRs, the same logic applies: every structural move needs a measurable target and a cadence to review it.
A worked example: a mid-market SaaS team
Below is what a compressed value chain analysis looks like for a hypothetical SaaS team running at about USD 12M ARR. Numbers are illustrative.
Five activities matter. Four are at parity or weaker. The structural moves write themselves: invest in onboarding and engineering productivity, cap marketing, defend sales, stop pretending pricing is a differentiator. That is four real decisions in a single planning meeting. Most quarters do not produce four real decisions.
The value chain analysis is not what made those decisions obvious. The conversation in Step 4 made them obvious. But the analysis forced the conversation, which is the entire point.
Where value chain analysis fits with other strategy tools
Value chain analysis is one of a handful of tools that operate at the activity level. It works best alongside tools that operate at the portfolio and execution levels. The combination tends to look like this.
At the portfolio level: BCG matrix. The BCG matrix tells you which products or business units to fund, cap, or stop. Value chain analysis tells you why. Use the matrix to set the portfolio call, then use the value chain to find the activities that explain the pattern.
At the planning level: strategic roadmap. Once the structural moves from Step 4 are written, they need a roadmap that sequences them across quarters. Without sequencing, every move competes for the same attention and none of them lands.
At the execution level: weekly check-ins. The single biggest reason value chain analyses fail to change anything is the absence of a check-in cadence. The moves degrade over time unless someone reports on them every week. Pick a cadence and protect it. The cadence is the strategy.
At the diagnostic level: what is strategic planning. If your team has never done a structured strategic planning cycle, run that first. A value chain analysis inside an undefined strategy will produce confident answers to the wrong questions.
Common questions
Is value chain analysis still relevant for software businesses? Yes, but the activity labels need updating. Inbound and outbound logistics map to onboarding and lifecycle. Operations maps to engineering and infrastructure. The structure of the analysis still holds. Only the labels change.
How long should this take? A first pass takes about three hours with the right people in the room. The right people are the ones who own the activities and have honest cost data. Without them, you are guessing.
How often should we redo it? Once a year is plenty if the business is steady. Twice a year if you are scaling fast or pivoting. The point of the analysis is to inform planning, so redo it before each major planning cycle, not in the middle of one.
What is the difference between value chain analysis and SWOT? A SWOT analysis is broader and more subjective. Value chain analysis is narrower and more numeric. SWOT is good for situational awareness. Value chain analysis is good for resource allocation. They answer different questions and they are not interchangeable.
Turn your value chain into outcomes that actually move
A value chain analysis is only as good as the operating cadence that follows it. Most teams produce a strong analysis, write down three or four structural moves, and then watch them quietly evaporate over the next two months because nobody reports on them in a structured way.
Tability is the operating layer that holds those moves accountable. Convert each structural move from Step 4 into a measurable outcome, attach an owner, set a weekly check-in, and the moves stop drifting.
Sign up free or book a demo and we will help you wire your next value chain analysis into a quarterly plan that actually shifts the business.
.png)
.jpg)