Most teams meet the BCG matrix in a marketing class, draw it on a whiteboard once, then never use it again. That is a shame, because the matrix is doing something genuinely useful underneath the buzzwords. It forces a conversation that most leadership teams keep avoiding.
That conversation goes like this. We have eight things on the go. They are not equally valuable. We are pretending they are. What do we actually want to fund, what do we want to cap, and what do we want to stop?
This article walks through what the BCG matrix is, how to use it without sounding like a 1970s consultant, where it falls over, and how to apply the same portfolio thinking to the work your team is doing right now. Not just to your business units.
What the BCG matrix actually is
The BCG matrix, sometimes called the Boston Consulting Group matrix or the growth-share matrix, was created by Bruce Henderson at BCG in 1970. It is a two-by-two grid that helps you decide where to invest, where to cash out, and where to cut your losses across a portfolio of products or business units.
The two axes are deliberately simple.
- Vertical axis: market growth rate. Is the market this product sits in growing fast or slow? Fast usually means "worth fighting for". Slow usually means "already settled".
- Horizontal axis: relative market share. How big is your slice compared to the largest competitor? High share usually means you have economies of scale and pricing power. Low share usually means you are still trying to earn a seat at the table.
Cross those two questions and you get four quadrants. Each one comes with a default playbook.
The four quadrants of the BCG matrix
Here is the version that fits on one page:
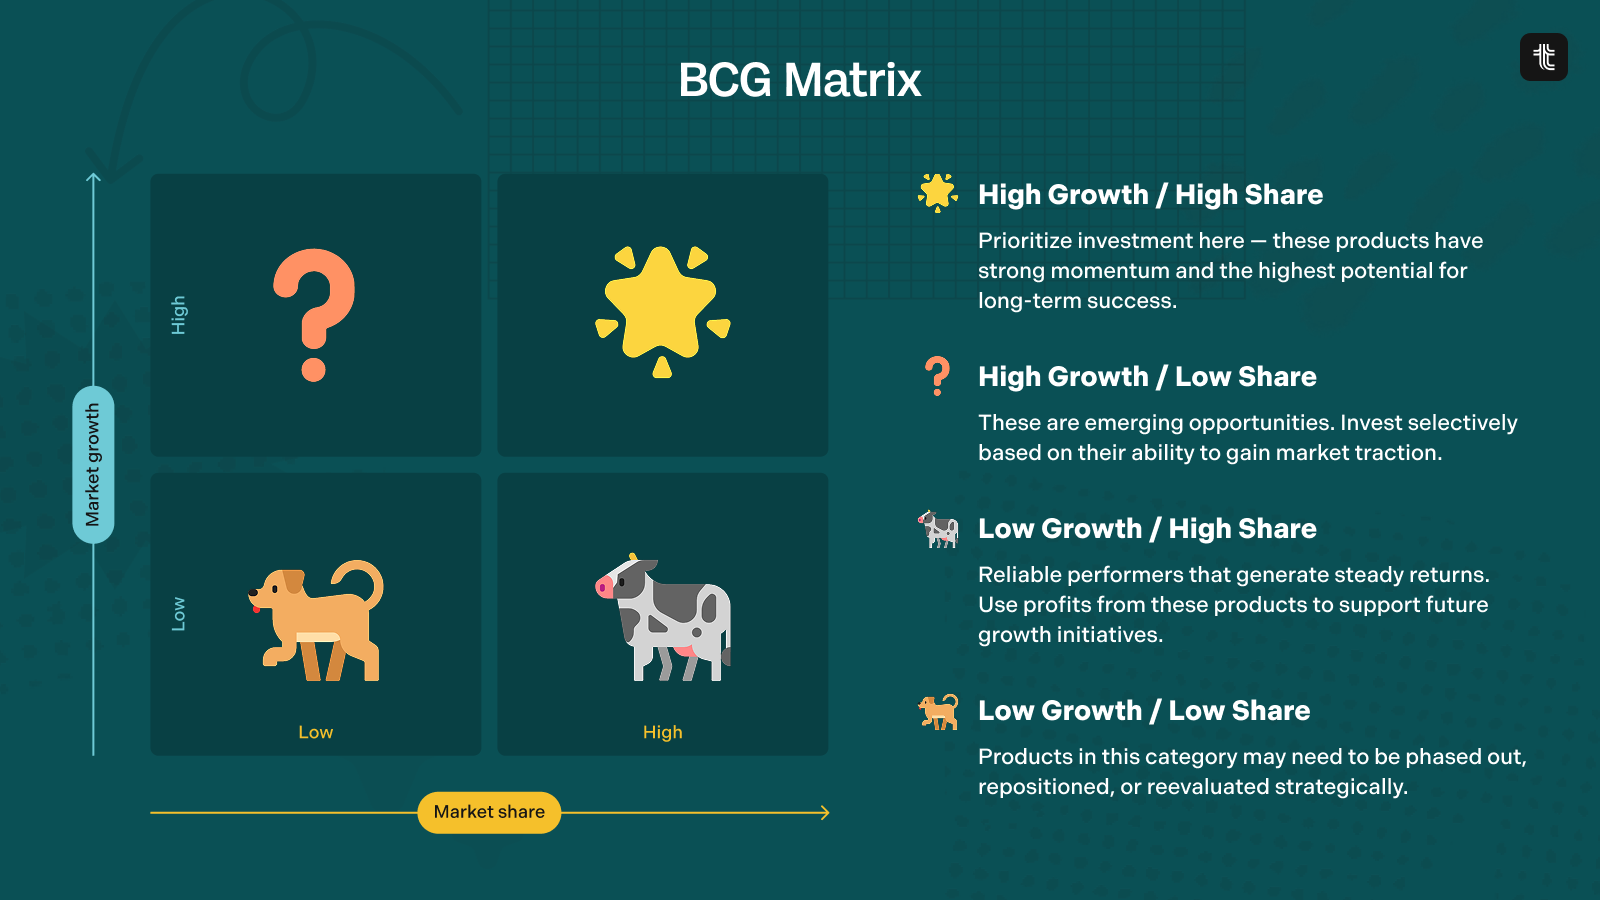
The reason the model has stuck around for fifty years is that it captures a real tension every leadership team faces: the cash that pays for tomorrow's bets has to come from yesterday's wins. Cash Cows fund Stars. Stars defend the future. Question Marks are options on growth. Dogs distract you.
That is the whole shape of it. Everything else is detail.
How to build a BCG matrix step by step
If you want to do this properly rather than draw a vibe-check on a whiteboard, follow these steps.
- List the units. Pick the right level of granularity. For a holding company that might be operating divisions. For a SaaS company it is usually product lines. For a consultancy it is service lines. Do not mix levels.
- Pull the share data. Estimate your relative market share against the largest competitor in each unit's category. A relative share above 1.0x means you are the leader. Below 1.0x means you are not.
- Pull the growth data. Estimate the annual growth rate of each unit's market. The original cut was 10% as the line between high and low growth. Adjust it for your sector if 10% is unusually high or low.
- Plot the bubbles. Each unit becomes a circle. Position is share and growth. Size is revenue (or whatever else makes sense to weigh things by). The picture should immediately show where the cash is being made and where it is being spent.
- Argue about it. This is the actual point. The picture surfaces uncomfortable questions like "why are we still spending engineering effort on that Dog" or "that Question Mark has been one for two years now, what changed". You want the argument.
If you skip step five, you have a poster, not a tool.
A worked example: a fictional SaaS portfolio
Imagine a mid-sized SaaS company with four product lines.
- Project management platform. Mature category, the company is the second-largest player. Generates most of the company’s revenue. Growth is slowing as the category matures. This is a Cash Cow 🐄
- AI meeting assistant. The category is exploding, the company has a credible early product but is not dominant yet. This is a Question Mark❓
- Employee engagement surveys. Highly competitive market with several entrenched players, the company has low share and low momentum. This is a Dog 🐕
- Executive planning and forecasting workspace. New category, the company has strong early signals and a defensible angle, growth is fast. This is a Star ⭐️
The picture tells you something specific. Milk the project management platform. Defend the executive planning Star with whatever it takes. Bet on the AI meeting assistant but with a clear time-box and decision date. Get out of employee engagement surveys even though sunk cost says keep going.
That last one is the hardest. Most companies hold on to Dogs because someone built them and someone bought them. The matrix gives you cover to have the conversation.
Where the BCG matrix breaks down
The model is forty-five years old. It shows.
- Two axes is not enough. Market share and growth do not capture brand strength, customer loyalty, regulatory risk, switching costs, network effects, or the strategic value of a product to the rest of the portfolio. A Dog by share and growth might be the entry point that gets you the customer.
- Market definition is loaded. Define the market narrowly enough and any product is a Star. Define it broadly enough and any product is a Dog. The framing decides the answer, which means the framing is where the politics live.
- It assumes share equals profit. That was true in industrial 1970s economies. It is not always true now. Some categories have permanently fragmented economics. Some Stars never make money.
- It is a snapshot, not a movie. The matrix tells you where things are today. It does not tell you the trajectory. A Cash Cow on the way to becoming a Dog needs different treatment than a Cash Cow that will stay one for ten years.
None of this means the matrix is useless. It means do not run your strategy off it alone. Pair it with strategic pillars, a strategic roadmap, and a real conversation about why each unit is where it is.
The modern application: portfolio thinking for initiatives
Here is the move most teams miss. The BCG matrix is taught as a tool for thinking about business units. The same logic, with one substitution, becomes a tool for thinking about your initiatives.
Replace "market growth" with "strategic upside if it works". Replace "relative market share" with "how confident are we that we can actually win this". Now your initiative list lays out into a matrix that looks like this.
This version is more useful for an operating team because it answers the question that actually shows up in your week. Where should the team's energy go in this quarter? What should we stop pretending is going to ship? What is the one bet that needs more support than we are giving it?
It is also harder to game. "This is a Star initiative" is a claim you have to defend with evidence. "This is a Dog initiative" is a decision you have to be willing to make publicly. That discomfort is the value.
From categorisation to action
The trap with any 2x2 framework is the same. The picture feels like progress. Then nothing changes. The team keeps working on whatever they were working on before. The Dog still has someone tending it. The Question Mark gets a sliver of effort instead of a real bet. The Star sits unfunded because three people insisted on equal time for their Cash Cows.
The way out is to wire the framework into how you actually run the quarter.
- Make the categorisation public. Put it in your plan, not a deck. Everyone sees which initiatives are Stars and which are not.
- Match resourcing to the category. Stars get full teams. Cash Cows get a maintainer. Question Marks get time-boxed exploration. Dogs get a sunset plan with a date.
- Re-cut every quarter. Markets move. Initiatives change shape. The matrix is a living artefact, not a one-time exercise.
- Tie it to your goals. Each Star initiative should be wired to a measurable outcome. That is what stops categorisation drifting back into vibes. If a Star initiative does not have a clear key result, it is not actually a Star, it is a wish.
This is exactly the loop that OKRs are supposed to close, and where most teams go wrong is that the categorisation lives in one tool and the execution lives in another. They drift apart by week three of the quarter.
Start using your portfolio mindset on real work
If you have ever opened a strategy deck and seen a beautiful BCG matrix that no one ever updates again, you know the problem. Categorisation is easy. Following through on the implications is hard.
Tability is the operating layer that connects strategy decisions to weekly execution. Pick your Stars, Cash Cows, Question Marks and Dogs at the strategic initiatives level, and Tability keeps you honest about which ones are still earning their place.
Tability is the operating layer that connects strategy decisions to weekly execution. Pick your Stars, Cash Cows, Question Marks and Dogs at the strategic initiatives level, and Tability keeps you honest about which ones are still earning their place.
Sign up free or book 30 minutes and we will help you map your current portfolio to where the energy actually needs to go this quarter.
.png)
.jpg)