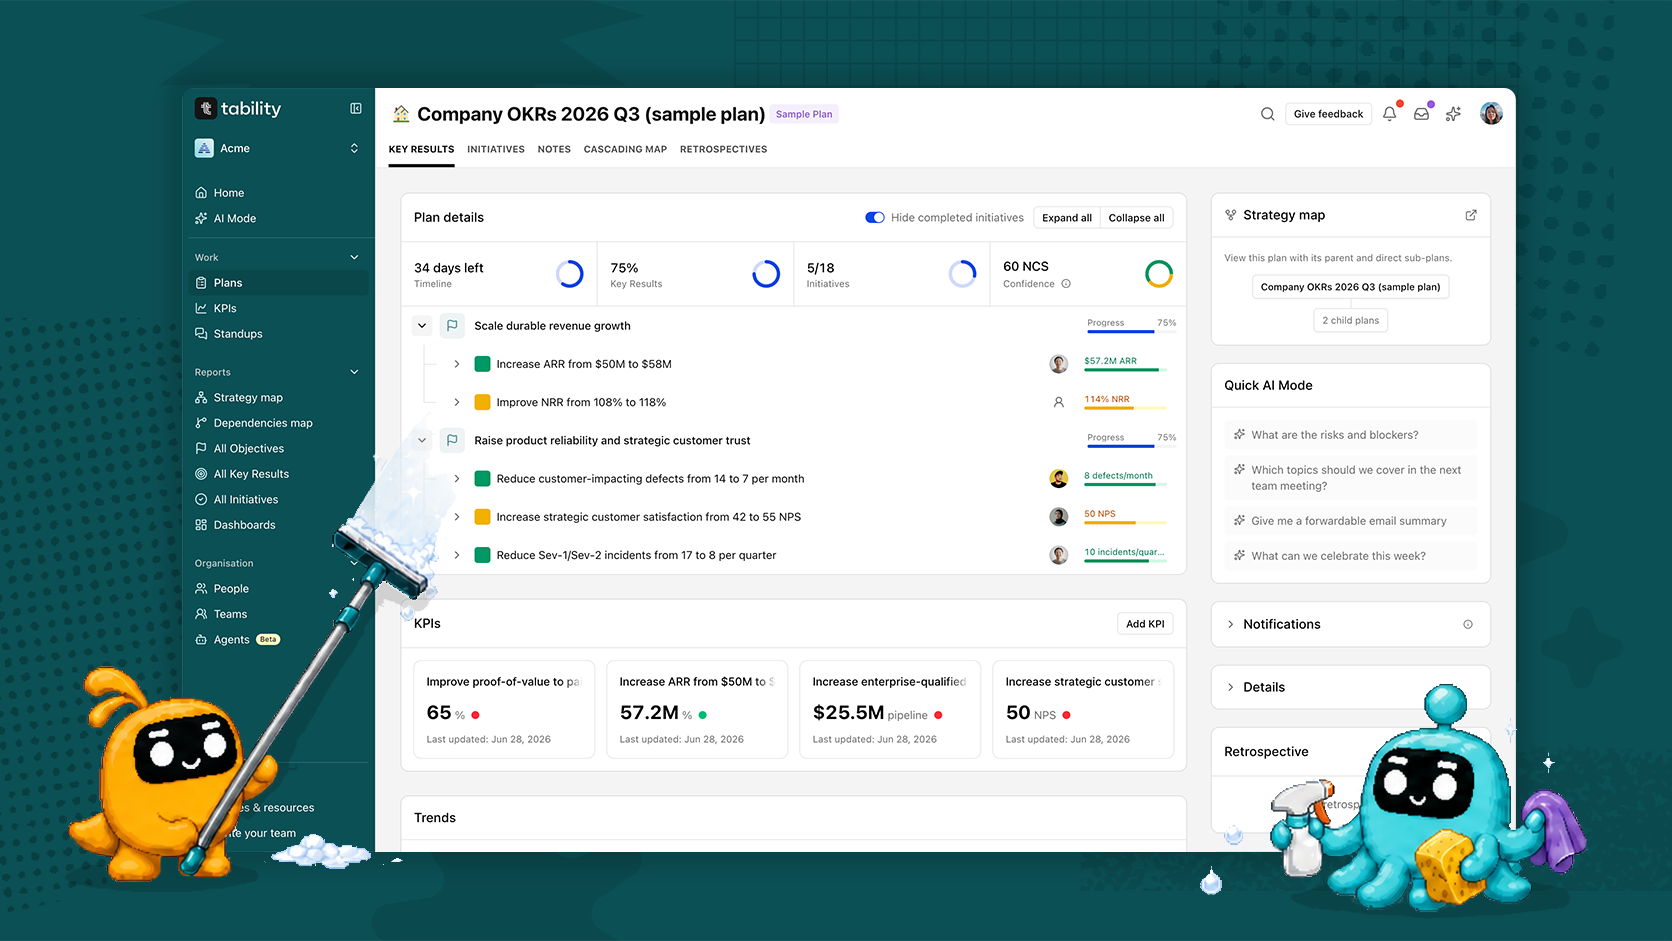
Your OKRs set the direction for what you want to improve. Your KPIs help you keep an eye on the health of the business along the way. Bringing them together gives your team more context for deciding what needs attention.
Tability brings those KPIs into the same workspace as your OKRs. Our latest improvements make them easier to review and maintain:
- Choose the date range you need
- Compare actuals with targets
- Edit values directly
- Import or export CSV data
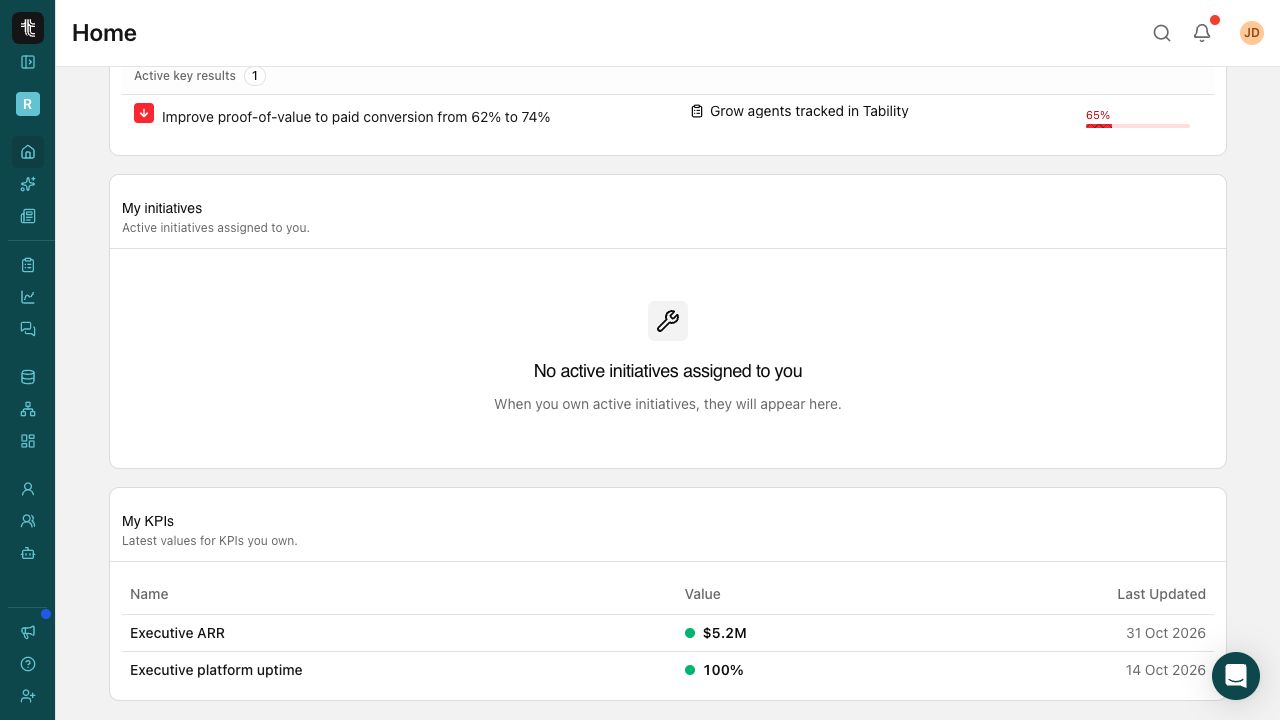
You can also find the KPIs you own on My focus, alongside your key results and initiatives.
Open a KPI in your workspace to explore the changes, or start a Tability trial to bring your KPIs next to your OKRs.
Screenshots in this post use fictional data.
Why keep KPIs next to your OKRs
KPIs help you monitor the ongoing health of your business. OKRs give your team a shared focus for the improvements you want to make during a quarter.
The same metric can play a part in both: you might track trial activation continuously as a KPI and set a key result to increase it from 40% to 60% this quarter.
Reviewing them together helps you see whether you're making progress on your priorities while keeping the rest of the business healthy. For an onboarding OKR, that could mean checking activation alongside retention and support response time. An improvement in one metric deserves a closer look if another starts slipping.
Your KPI history also continues beyond the OKR cycle, helping you see whether the gains last and where to focus next. Keeping both in Tability makes that context easier to bring into your team's review.
For a deeper explanation, read our guide to OKRs vs KPIs and how to use both.
Review the period that matters
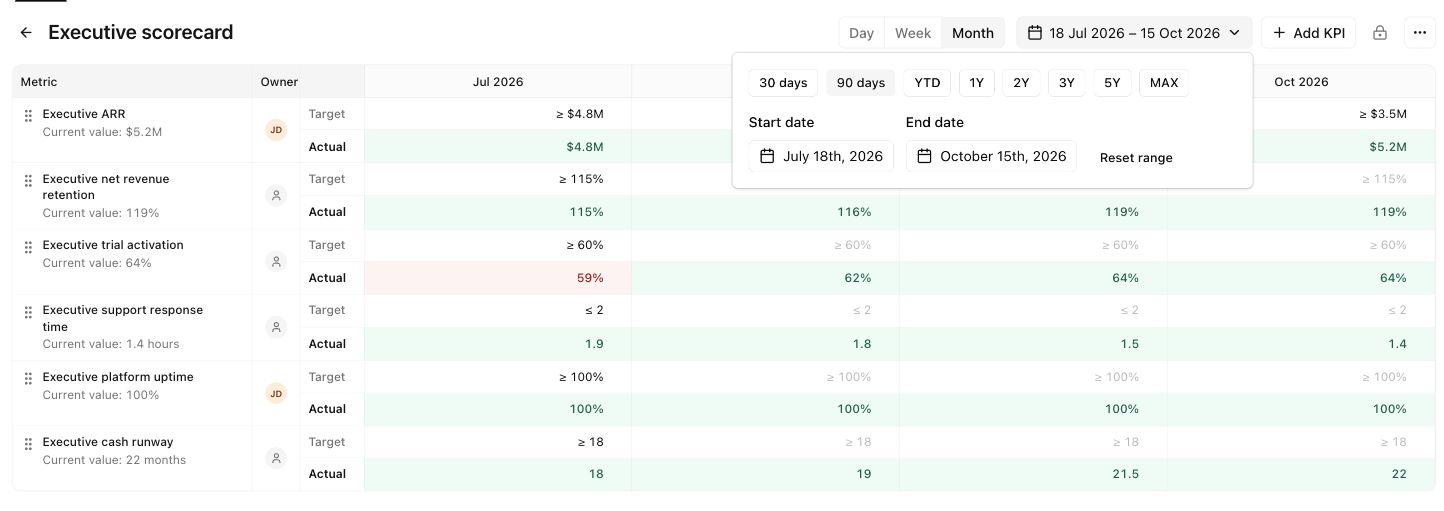
Use the same reporting period for your KPI review and your OKR discussion. Whether you're checking the past few weeks or looking back over a quarter, you can set a start and end date and use shortcuts for common ranges.
Choose the past 30 or 90 days, year to date, one to five years, or the full available history. Switch between daily, weekly, and monthly views to choose the level of detail you need.
The date range controls work in individual KPIs and KPI Views, where you can review several metrics together. That makes it easier to focus on a specific reporting period without losing access to the longer history.
For a quarterly OKR review, set the dates to match the quarter. For a weekly check-in, start with the past 90 days to put recent changes in context. Expand the range when you need to understand a longer trend.
Read actuals and targets together
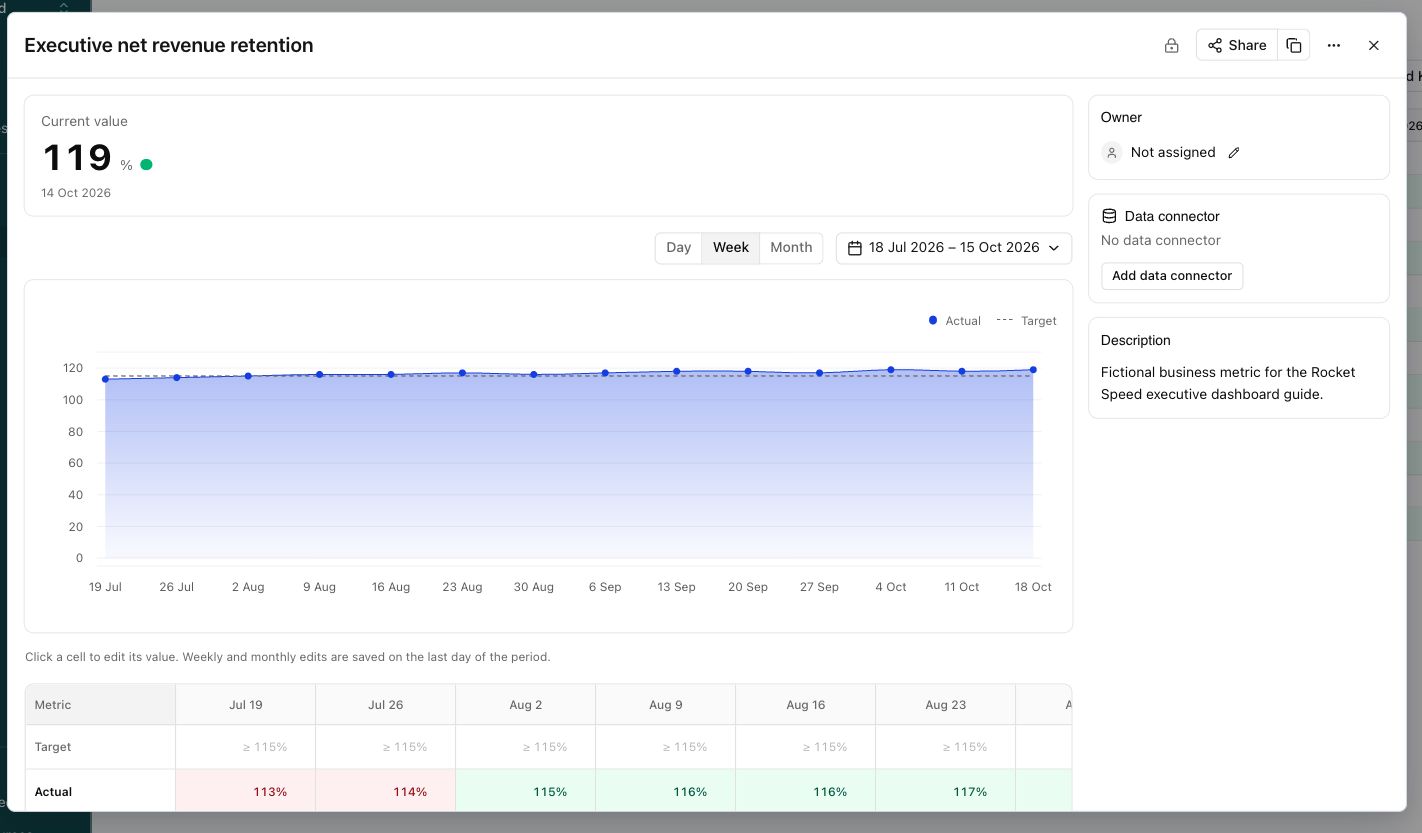
The updated KPI charts make it easier to compare recorded results with targets over time. The chart follows your selected period, and hovering over a point gives you its date and value.
Charts and tables work together, so you can move from a trend to the figures behind it. If something looks unusual, inspect the relevant period in the table and check whether the underlying value needs attention.
This is particularly useful when a target changes during the year. You can review performance against the target history alongside the actual results.
Make quick edits and bulk changes with less admin
We've made a major improvement to KPI data handling. Whether you're correcting one figure or bringing in months of history, you can keep your data up to date without working through hundreds of individual forms.
Correct values without leaving the table
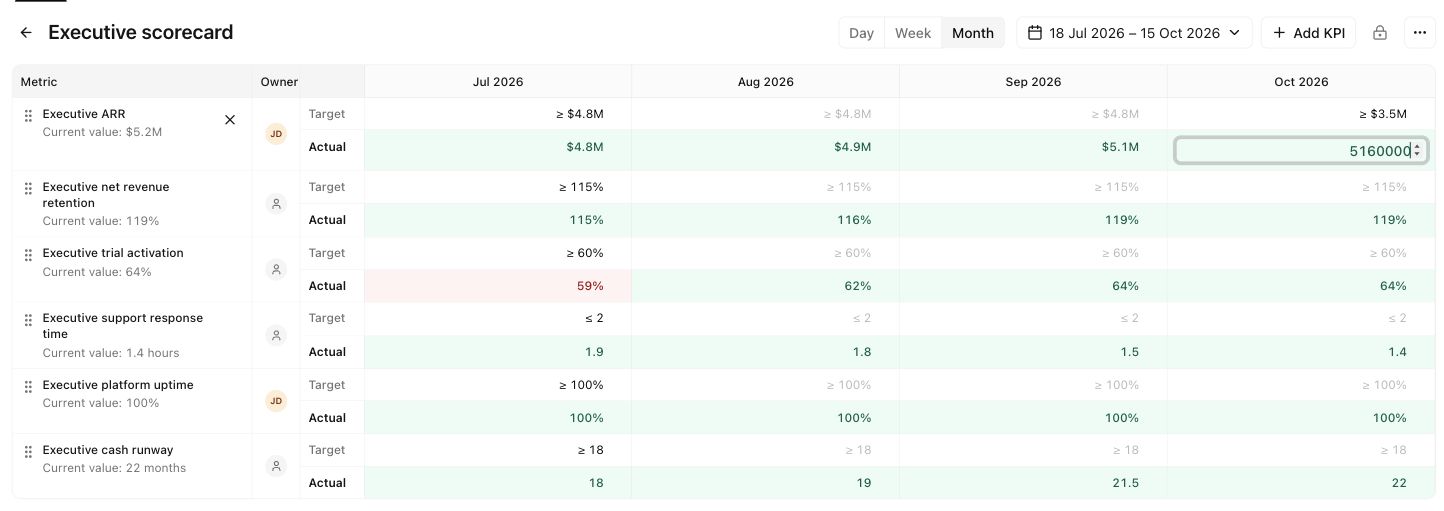
Click an actual or target cell to edit it in place, then press Enter to save or Escape to cancel. This works in individual KPIs and KPI Views, so you can make quick corrections while reviewing several metrics with your team.
Weekly and monthly edits are recorded on the last day of the selected period. Use the daily view when the exact date matters.
Update a whole dataset in one go
For larger changes, use CSV files to move data between Tability and your spreadsheet:
- Export a KPI's recorded actuals and targets, including their original dates, for analysis or cleanup.
- Import a CSV to bring in historical data. Download the template if you're starting from an existing spreadsheet.
- Replace existing data to update the KPI's full history from a corrected file.
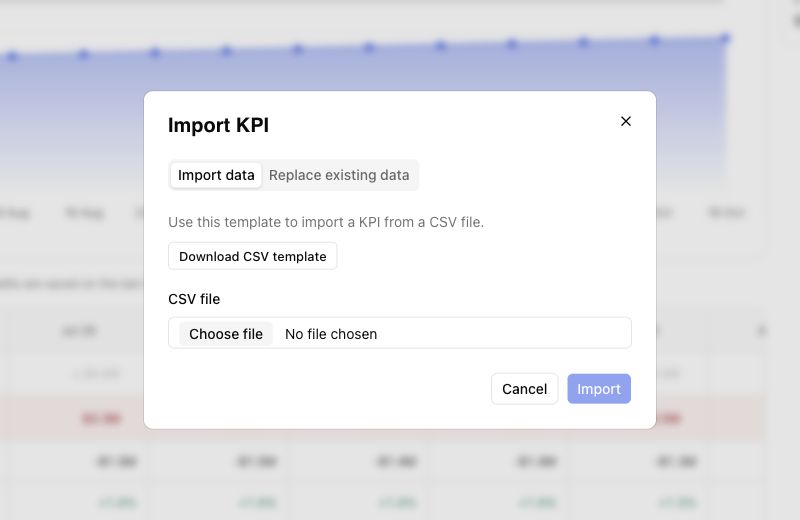
You can also clear all actuals or all targets separately, keeping the KPI itself. Clearing and replacement apply across the full history, including dates outside the range you're viewing. Tability asks for confirmation before clearing data and requires you to download the existing data before replacement.
When you need figures from a team review, export a KPI View. The export follows its selected periods and row order.
Control who can view and edit
Both KPIs and KPI Views have permissions. Give people or teams access to review the numbers, and edit access to those responsible for maintaining them.
A KPI View's permissions and the permissions on its individual KPIs are managed separately. Sharing a scorecard can give your team a common place to review performance while keeping control over who can change the underlying data.
Find your KPIs on My focus
Every user as a dedicated personal dashboard called My Focus. It brings your key results, initiatives, and owned KPIs onto the same page. You can check progress toward your OKRs and review the business metrics you're responsible for as part of the same routine.
You can see their latest values and when they were last updated, then open a KPI to investigate or add data. Ownership determines which KPIs appear here, so assigning an owner also gives each metric a clear place in someone's routine.
Before your weekly OKR check-in, review your KPIs too. Which figures have changed, which need an update, and which suggest a risk or opportunity worth discussing with the team?
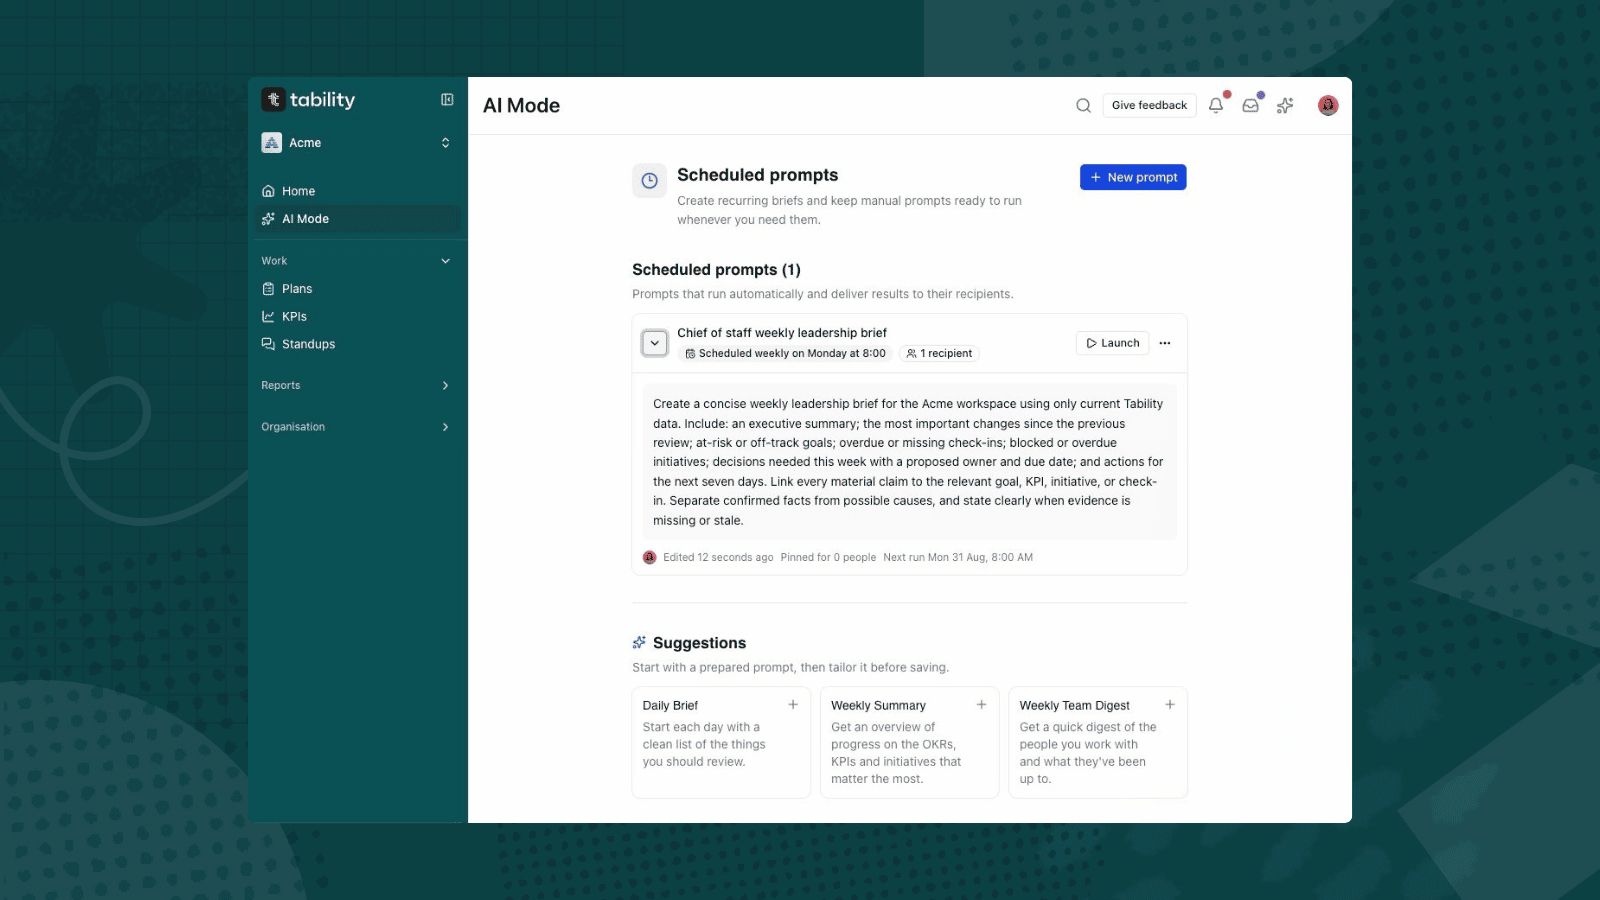
AI Mode can also create KPIs and KPI Views for you. Describe the metrics you want to track, who should own them, and how you'd like to group them:
Create KPIs for annual recurring revenue, net revenue retention, and average support response time. Assign them to me so they appear on My focus.

Group them in a KPI View called "Leadership scorecard" with weekly periods. Reuse matching KPIs if they already exist, and ask me for any missing starting values or targets.
Review your KPIs and OKRs together
Start with a few KPIs that give useful context to your OKRs. Give each one an owner, bring in its history, and group related metrics into a KPI View. For an onboarding objective, that might mean keeping activation, retention, and support response time in a shared scorecard.
At your next OKR review, check both progress toward your key results and the health of those KPIs. Compare actuals with targets, investigate unexpected changes, and use what you learn to decide where to focus next.
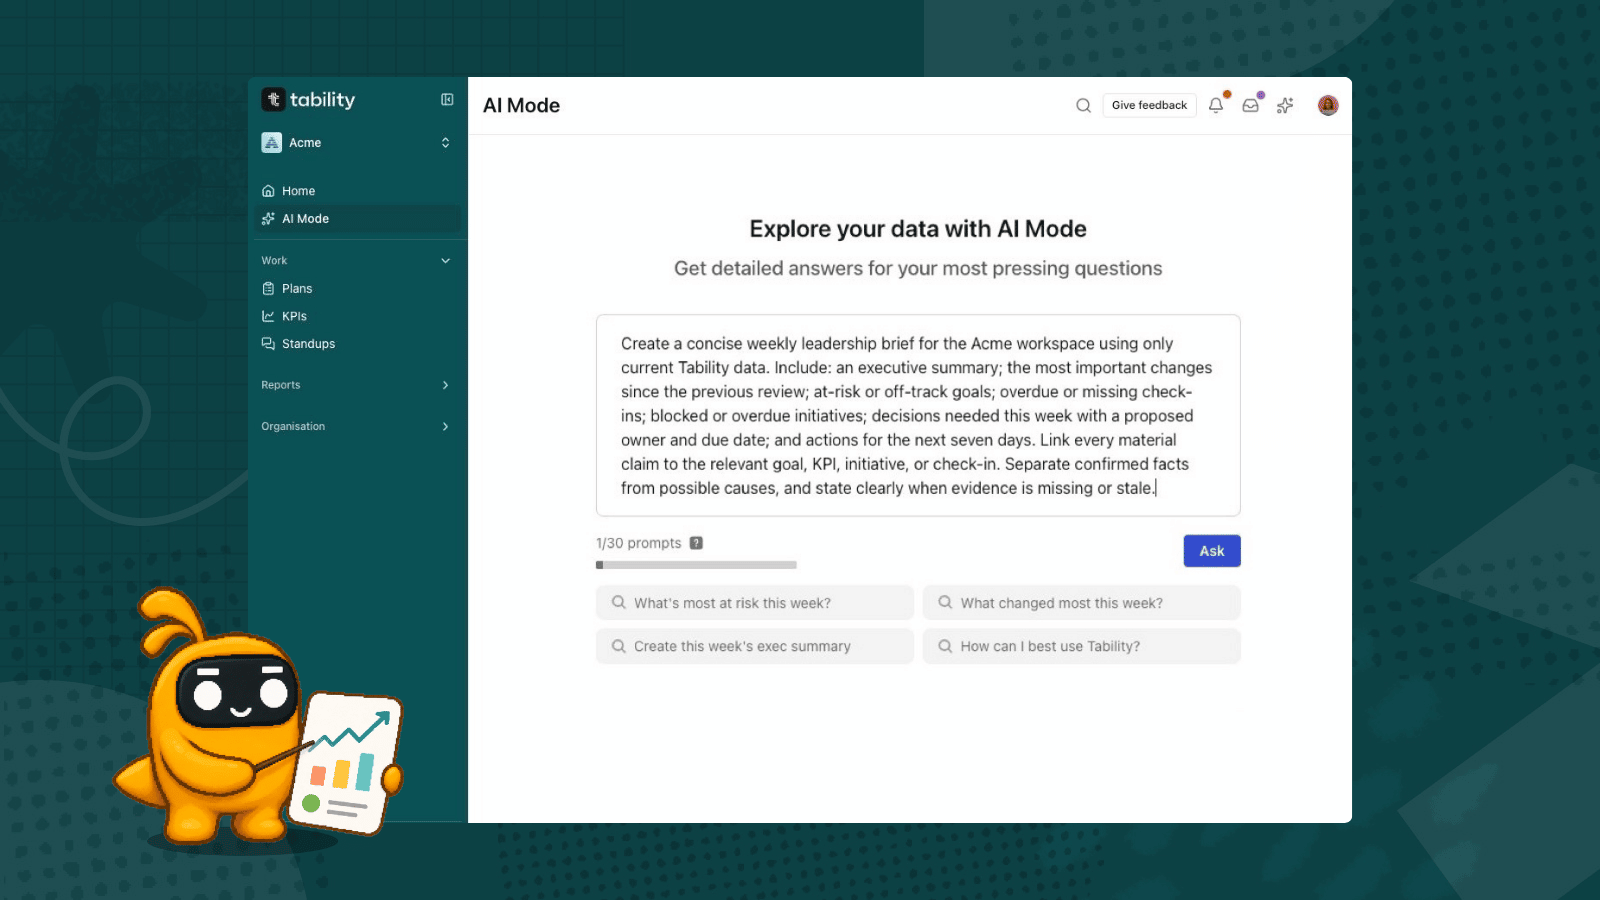
You can also ask AI Mode to help prepare for that conversation:
Review my active OKRs and the KPIs I own before my weekly check-in. Summarise key result progress, highlight KPIs missing their targets or needing fresh data, and suggest questions to discuss with my team.

Use recorded values and targets, link to the relevant goals and KPIs, and flag missing information.
You can even go one step further and get AI Mode to build you a shareable KPI dashboard – zero click required.
Open Tability to review your KPIs alongside your OKRs, or start a trial to bring your goals and business metrics together.

.jpg)
.png)