Most leadership offsites end the same way. Someone projects a 2x2 grid, the team plots their 'growth strategy' in one of the four squares, and the slide ends up on page 47 of the quarterly deck. Then the quarter starts, and the matrix is never opened again.
That is the gap. The Ansoff matrix is genuinely useful for shaping a growth strategy. Most teams treat it like a poster. They use it to make a one-time decision and then go back to running the business the same way they did before.
The real work is not picking a quadrant. It is turning that pick into a set of bets you can run, measure, and revisit. This guide covers the four quadrants quickly, then spends most of its time on the part nobody talks about: the operating cadence that takes the Ansoff matrix from a slide to a system.
What is the Ansoff matrix?
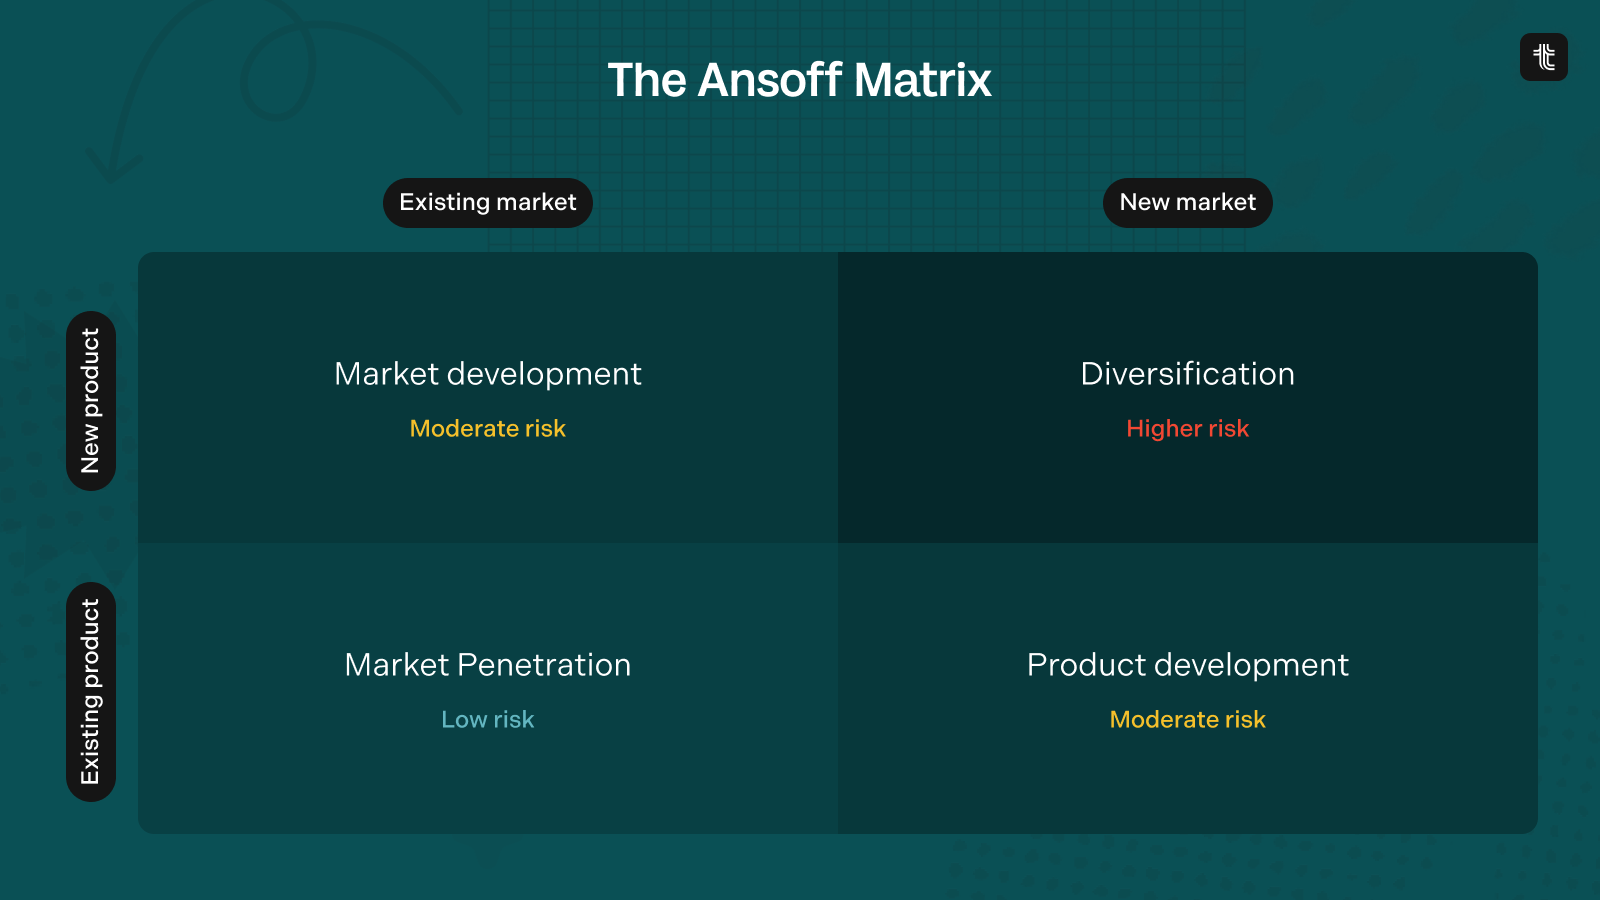
The Ansoff matrix is a strategic planning tool that maps four growth strategies onto a 2x2 grid. The two axes are products (existing or new) and markets (existing or new). The four resulting quadrants represent four ways a company can grow: market penetration, market development, product development, and diversification.
Igor Ansoff, a Russian-American mathematician and management consultant, first published the framework in a 1957 Harvard Business Review article called 'Strategies for Diversification'. His goal was practical: give executives a single, simple model that forced them to be specific about which kind of growth they were planning, and what level of risk came with it.
Almost seventy years later, the framework is still on every MBA syllabus. The reason it has stuck around is that the underlying question, 'are we trying to do more of the same, or something genuinely new?', never goes out of date.
The four growth strategies in the Ansoff matrix
Each quadrant of the Ansoff matrix represents a different kind of growth bet. They are not mutually exclusive, but most companies should have a clear primary bet at any one time. Spreading effort across all four quadrants is how strategies die slowly.
Market penetration (existing product, existing market)
Sell more of what you already have to the people who already buy from you. The lowest-risk quadrant, and usually the slowest growth. Tactics include increasing share among existing customers, undercutting competitors on price, deepening account penetration, or pushing usage. Most mature companies live here whether they admit it or not.
Best for: profitable companies looking to extend their lead in a market they already understand.
Market development (existing product, new market)
Take the product you already sell and find new buyers for it. New geography, new vertical, new customer segment. Risk is moderate. You know the product works. You do not yet know whether it works for these new customers. Most expansion plays sit here: opening an EMEA office, going from SMB to mid-market, selling to a new industry.
Best for: product-market-fit companies that have squeezed their original segment and are ready to expand.
Product development (new product, existing market)
Build something new and sell it to the customers you already have. Risk is moderate to high, depending on how big the build is. Your distribution is solved. Your audience is known. The bet is whether you can ship the product and whether customers actually want it.
Best for: companies with strong customer relationships and a credible adjacent product opportunity.
Diversification (new product, new market)
A new product for a new market. The highest-risk quadrant by far. Most diversification bets fail because the company is solving two unknowns at once: building something it has never built, then selling it to people it has never sold to. Done well, it creates the next leg of growth. Done badly, it sinks the existing business.
Best for: large companies hedging against existing-market decline, or founders with strong evidence that the new market is real.
Risk and time horizons: what each quadrant actually costs
The Ansoff matrix is sometimes presented as if you simply pick the quadrant that 'fits'. In practice, the four quadrants represent very different risk profiles and time horizons, and treating them as if they are equivalent is how growth budgets get burned.
Penetration is the safest quadrant but capped. You cannot grow market share past 100%. At some point, the well runs dry and you have to move outwards.
Market development is moderate risk. The product is proven, but local context, regulation, sales motion, and competitive dynamics all change as you move into a new market. Most companies underestimate how much go-to-market needs to be rebuilt for each new segment.
Product development is moderate risk but eats internal capacity. The cost is mostly in engineering, design, and customer research. The blast radius is contained: if the new product flops, the existing one is still there.
Diversification is the highest risk and the longest horizon. Expected value can be large, but the probability of success is small. The mistake is treating diversification as a fifth quadrant of 'main effort'. It should usually be a small, ring-fenced bet, not a core strategy.
The matrix tells you the shape of the bet. It does not tell you the size. That is a separate decision.
Ansoff matrix examples
Examples are useful only when they make the categories concrete. Here are four that do.
Market penetration: Coca-Cola
Coca-Cola has spent decades doing market penetration in the United States. The product is the same. The market is the same. The work is fountain placements, vending agreements, loyalty programs, and small format-level innovations (cans vs bottles vs glass). Growth is incremental, but the cumulative effect is enormous because the base is so large.
Market development: Starbucks
Starbucks's expansion into India, Vietnam, and the Middle East is a clean market-development play. Same product, same operating model. The unknown is whether the cultural and economic conditions in the new geography support the same coffee-as-third-place positioning. Sometimes they do (China). Sometimes they do not (Australia, where Starbucks famously stumbled).
Product development: Apple
Apple selling iPad, Apple Watch, and AirPods to existing iPhone customers is product development at scale. The customers were known. The distribution channels were owned. The bet was whether each new device would be enough of a 'must have' to justify the spend. Most of them were.
Diversification: Amazon Web Services
Amazon Web Services is the canonical diversification story. New product (cloud infrastructure), new market (developers and IT buyers, not retail consumers). The risk profile was high enough that Amazon ran it as a separate business for years. It is now larger than the original retail business in operating income.
Where most teams use the Ansoff matrix wrong
The matrix is treated as a strategy decision. It is not. It is a hypothesis-allocation tool.
Once you pick a quadrant, you have made a bet about where the next dollar of incremental effort should go. The bet only pays off if you actually run it, measure it, and shift resources when the data comes back. Most teams skip those steps.
A common failure looks like this. The leadership team picks 'market development' at the offsite. Ninety days later, nothing about the GTM org has actually changed. The quarterly targets still reflect last year's geography. Product velocity is still going entirely into the home market. The matrix decision is real on the slide and fictional in the operating plan.
To be frank, the Ansoff matrix is one of the easiest frameworks to misuse, precisely because it looks like the work is done once the quadrant is picked. The quadrant is the easy part. The operating cadence is where strategies actually get executed, and that is where StratOps comes in: it is the function that owns this cadence.
How to actually use the Ansoff matrix: a four-step operating cadence
This four-step cadence is what turns the Ansoff matrix from a one-time exercise into an operating system. The matrix gives you the bet. The cadence gives you the discipline to run it.
- Pick the dominant bet. One quadrant gets the majority of incremental effort this year. The other three keep ticking over, but the new resourcing and the new operating focus point to the dominant one. Trying to balance the four quadrants equally is how you end up doing none of them well.
- Translate the bet into measurable outcomes. The quadrant choice becomes a small set of specific OKRs. Market development might mean “open a UK office, sign 12 paying UK customers, hit £300k UK ARR by Q4”. Vague language like “expand internationally” never survives contact with the operating plan.
- Set a weekly review cadence on leading indicators. Don’t wait for the lagging revenue number. Track pipeline created in the new market, sales conversations booked, beta sign-ups, launch readiness against a date. Weekly check-ins on leading indicators are where you learn whether the bet is working three months earlier than the revenue number will tell you.
- Quarterly reallocation review. Every quarter, hold a structured conversation about whether the bet still makes sense given the data. Do we double down? Do we hedge? Do we kill it and shift to a different quadrant? Resource reallocation has to be an explicit ritual, not a default-to-last-quarter pattern.
This four-step cadence is what turns the Ansoff matrix from a one-time exercise into an operating system. The matrix gives you the bet. The cadence gives you the discipline to run it.
Where the Ansoff matrix breaks down
The Ansoff matrix is useful as a framing tool, but it is not a complete plan. A few honest limitations:
- It’s a four-quadrant model. Real growth strategies are messier. A new product for a segment of an existing market is somewhere between product development and diversification, and the matrix doesn’t help you reason about that.
- It treats “new” as binary. A new geographic market with the same language and similar buyer behaviour is barely a new market. A new vertical that requires a completely different sales motion is closer to diversification, even though it nominally sits in “market development”.
- It says nothing about sequencing. The matrix can’t tell you whether to do market development this year and product development next, or vice versa.
- It ignores operational change. Picking a quadrant has implications for org design, hiring, capital allocation, and reporting structure. The matrix is silent on all of that.
The matrix is a 1957 framework. It works as a starting point. It does not work as a substitute for the operating decisions that follow. If you want a wider view of how growth frameworks fit together, the BCG matrix covers the portfolio side, and the strategic roadmap covers sequencing.
From a matrix on a slide to a system you can run
The honest version of using the Ansoff matrix is roughly this: the matrix tells you the shape of the bet. Everything else, including the outcomes, the cadence, the resource shifts, and the quarterly reallocation, is the actual work.
This is StratOps territory. Strategic operations is the function that bridges the gap between strategic decisions like an Ansoff quadrant pick and the weekly operating cadence that makes them real. Without that bridge, the matrix lives on a slide and the team runs business as usual.
Tools like Tability are where the matrix decision becomes a tracked outcome. Each quadrant bet gets an owner, a metric, weekly check-ins, and a scoring rhythm. The Ansoff quadrant stops being decoration and starts being part of the cadence.
The bottom line
The Ansoff matrix is a small, useful framework that gets used badly far more often than it gets used well. Pick the dominant bet. Translate it into outcomes. Run the weekly cadence on leading indicators. Revisit it quarterly and be honest about whether the data supports the bet. That is the version that actually moves the business.
The 2x2 is a starter, not a deliverable.
Turn the matrix into a quarterly plan
If you are using the Ansoff matrix to plan your next year of growth, the harder problem is turning that quadrant pick into an operating cadence the team can actually run. Tability is built for exactly that.
Sign up free or book 30 minutes with us and we will help you turn the matrix into a quarterly plan that does not gather dust.
.png)

.jpg)