(1).png)
No one likes to see customers churning. Ideally, we’d all be super close to our users, knowing how every team is doing, and ready to offer actionable advice to help people get the most out of our tools and services.
But this is something borderline impossible to do when you have 100+ new teams jumping in your product every week.
You can’t be everywhere so you need a simple way to understand where you should focus your efforts.
Our initial goal was simple: can we get a list of the top 25 customers to help in any given week.
Before we start: Always be GDPR-ready
Rules before we get into this:
- Always anonymised your data
- Send usage metrics (views, visits, etc…). Don't send customer data
Build vs. buy is different now
I asked ChatGPT about a ballpark cost for churn detection software and it’s basically $5k-$50k/year.
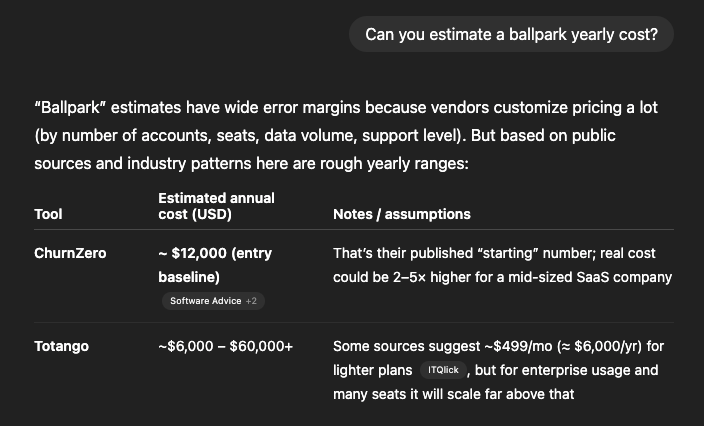
A year ago we would not have considered a “build” option for this. It’d be far too much effort and there’s a bunch of new knowledge to get around predictions and analysing timeseries.
But now?
With tools like Claude Code, ChatGPT, Cursor, etc it’s something that you can potentially build in a day. The benefits:
- Spend $10/month instead of $1k/month
- Plug things directly into your data
- Customise inputs/outputs as needed
To be clear, you’re not going to compete with ChurnZero in a day. But if you have a very specific need like us (a simple list of 25 customers), then this can become really fun.
Alright, here’s how we did it 👇
How to build your own churn detection agent
What it looks like
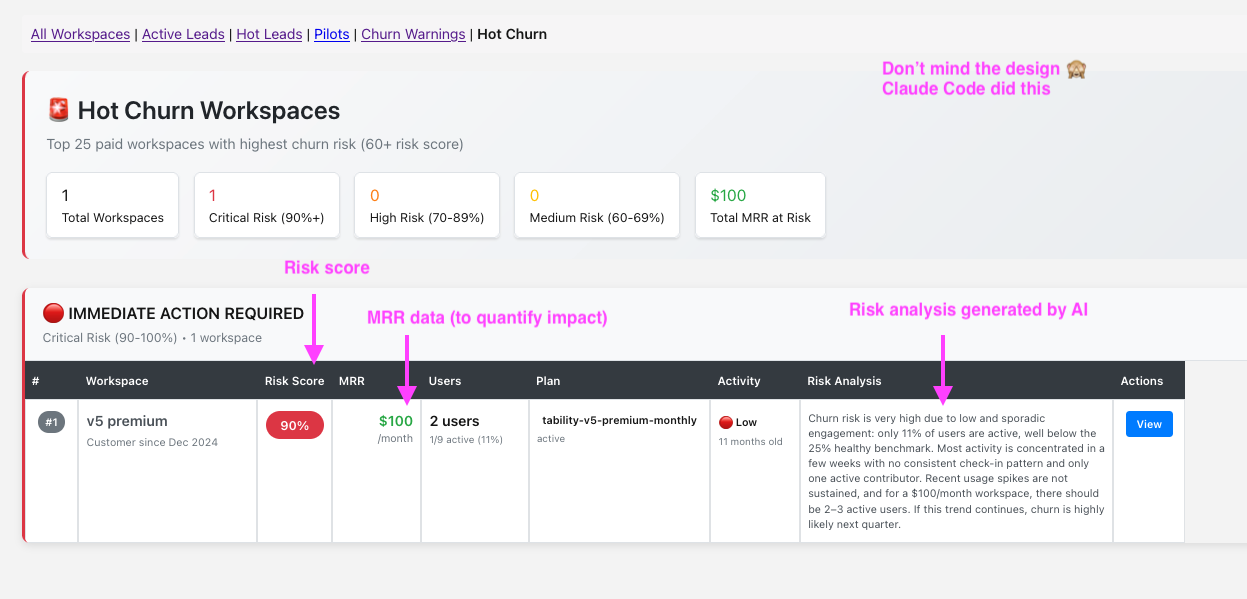
The final result is a page that lives in our internal tool platform. Yes, the design sucks. But I managed to vibe code this dashboard by myself just by interacting with Claude Code. What matters is that it does the job we want it to do:
- It’s live
- It’s a list of top 25 churn risks
- It has a risk score and a rationale for the risk score
Ok, so now let’s see how you can do this.
How our self-built churn agent works
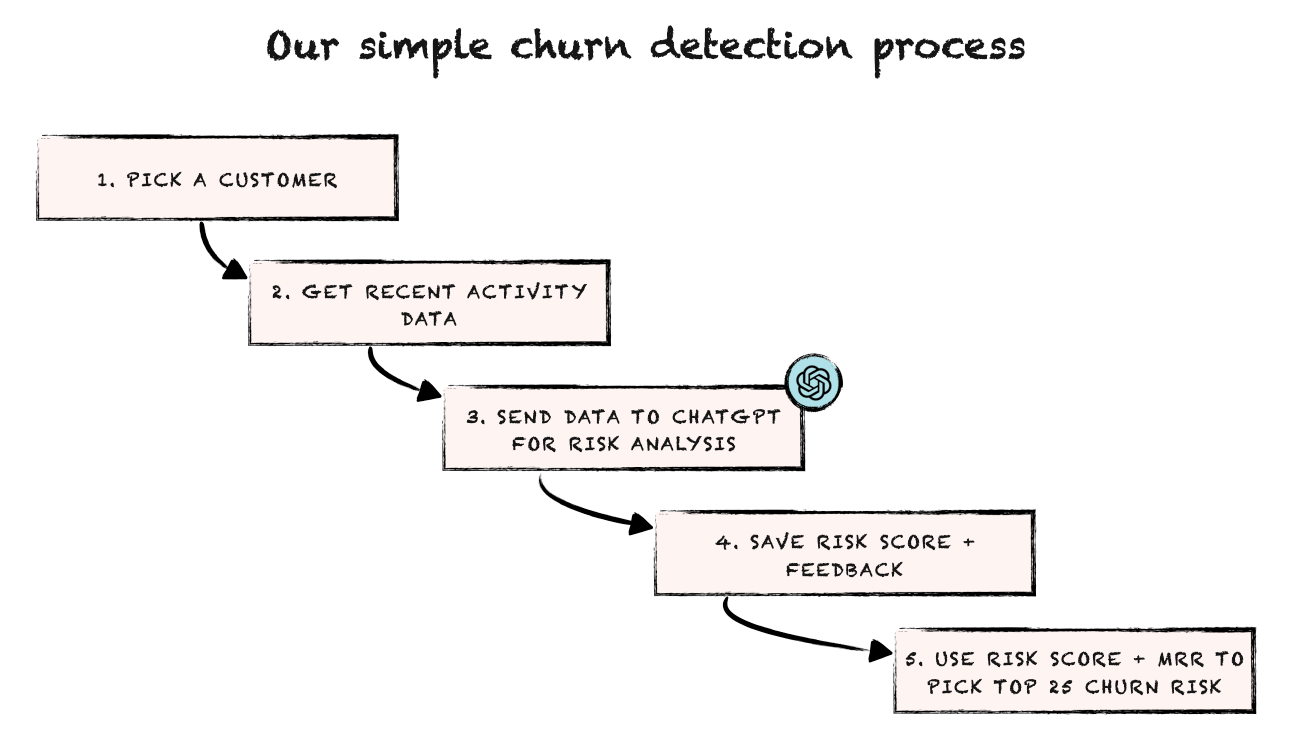
Step 1. Pick a customer
We initially tried to send all activity data for all customers in 1 single prompt with something along the lines of:
“Here’s everything. Plz give us 25 names”
This failed for 2 reasons:
- The final prompt was waaaay too large. OpenAI (ChatGPT) would just fail the request
- Even when it went through, we’d often face some hallucinations or weird results
It was quite difficult to build a simple prompt that would give us the right top 25. The LLM had to compare activities of customers that had completely different profiles and usage patterns.
A much easier approach is to evaluate risk individually for each customer:
- It’s much easier for the LLM to identify historical patterns
- You can do a much more sophisticated analysis by providing additional context such as percentage of active users, company size, date of creation, etc…
So step 1 of your future is to pick a customer ID or equivalent.
Step 2. Get recent activity data
The first thing that you need to do is to identify the core metric that you will feed back to the LLM. This should be a metric that correlates strongly with a happy and active customer:
- Metric goes up = low risk of churn
- Metric goes down = high risk of churn
The knee jerk reaction would be to look at the number of weekly active users (WAUs), but that’s usually a bad metric as it can be really noisy. There’s often another metric that can predict success much better than just looking at how many people log into your app.
- A project management platform might want to use # of tasks created/week
- An email marketing software could focus on # of emails sent/week
- A survey product should probably use # of survey responses/week
Find your metric. In our case we’re using the number of OKR checkins per week (check-ins). For an OKR platform like us, this metric predicts pretty accurately everything else. Teams that do check-ins tend to also add comments, feedback, create reports, add tasks, etc. Teams that don’t do check-ins, well, they tend to churn.
Then, we simply build a CSV export with 2 columns:
- Week: the week of the year (format YYYY-MM-DD)
- Checkins: the number of check-ins in that given week
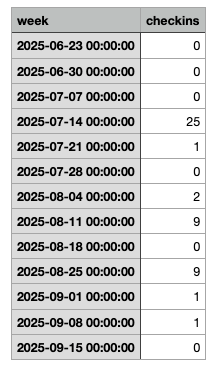
If you’re unsure of how you can get this data, you can just go to ChatGPT and ask for the right query.
This is what I did and it came up with the right PostgreSQL that I used to get the data.
Step 3. Send the data to ChatGPT for risk analysis
This is where the magic happens.
Rather than having to build our own predictive model, we just send the activity data of the last 12 weeks and rely on the LLM for identifying patterns showing usage drop-offs.
Quick tip: I always ask ChatGPT first to come up with the final prompt.
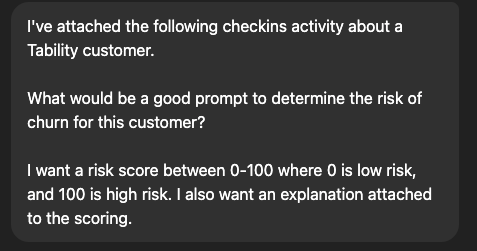
Our final prompt is something that’s quite simple, yet pretty effective.
You are an expert in SaaS customer success and churn prediction.

I will provide you with weekly check-in activity data for a customer.
Each row contains a week and the number of check-ins made during that week.

Your task:
1. Analyze the trend and consistency of the activity.
2. Provide a churn risk score between 0 and 100, where:
   - 0 means very low risk (customer is highly engaged and healthy).
   - 100 means very high risk (customer is disengaged and very likely to churn).
3. Explain the reasoning for the score, referencing specific activity patterns (e.g., periods of inactivity, spikes, or declining trends).
4. Keep the explanation concise but insightful (2–3 sentences).

Here is the data:
[Paste the CSV data here]

Output format:
{
  "risk_score": <number between 0-100>,
  "explanation": "<short paragraph>"
}
Step 4. Save risk score + feedback
This step is the easiest:
- Add 2 fields to our customer table
- Run the risk analysis for each active customer
- Store the risk data
We don’t run analysis for all customers at once. This is performed in hourly batches based on the hour a workspace was created at (helps spread API calls throughout the day).
Step 5. Use risk score + MRR to pick up the top 25 churn risks
The bulk of the work is done! At this stage you have:
- A function that generates weekly usage data
- A ChatGPT* function that evaluates usage data to determine the risk of churn
- The risk data stored against each customer
*we actually use OpenAI's chat completion API with gpt-4.1 for that.
We create our list of top 25 customers by running a simple SQL query that is the equivalent of
SELECT the first 25 customers WHERE
risk_score > 60
ORDER BY risk_score, mrr
You can adjust this to reduce noise (ex: have a MRR threshold, or only select customers that have been around for more than 30 days) but that’s pretty simple and effective.
The dashboard that you saw in the intro was then vibe coded in less than 1h with Claude Code.
Lessons learned
Here’s a quick list of things we’ve learned along the way:
- The more explicit you label your data, the easier it is for the LLM to understand what it deals with
- Don’t hesitate to break down your process in different API queries. You don’t have to do everything in 1 prompt
- Try different models! We use gpt-4.1 which proved to be enough but results will vary vastly based on the model you use.
- You can save a lot of time by going to ChatGPT, giving it a sample of data, and asking “what’s the best prompt to _______”.

.jpg)


.png)