When you're running a team, the question is almost always the same: what's off track, and how bad is it? You don't want to read through every plan to find out. You want to scan, spot the red, and go straight to it.
That's what maps are for. A good one lets you take in the state of your whole strategy in seconds, then drop into the part that needs you.
We've rebuilt both maps in Tability, and they're at least a 10x improvement on what came before. The strategy map zooms out across your whole workspace so you can see what's slipping at a glance. The dependencies map zooms in on a single goal so you can see exactly what it depends on and what's depending on it. Between them, they answer both ends of the question every leader is asking.
Here's everything that changed below.
👀 Want to see a live demo (available in 5 languages)
The strategy map, rebuilt
The strategy map gives you a macro view of your workspace. Every plan in one place, from Company OKRs down to each team, so you can see how everything connects without opening plans one by one.
That was always the upside. The downside showed up as soon as you had a few plans. The graph expanded to fit everything, and a useful overview turned into a wall you had to scroll through. You could spot a red or yellow key result and click into it, but finding it meant navigating a lot of noise first.
So we rebuilt it.
Everything starts collapsed
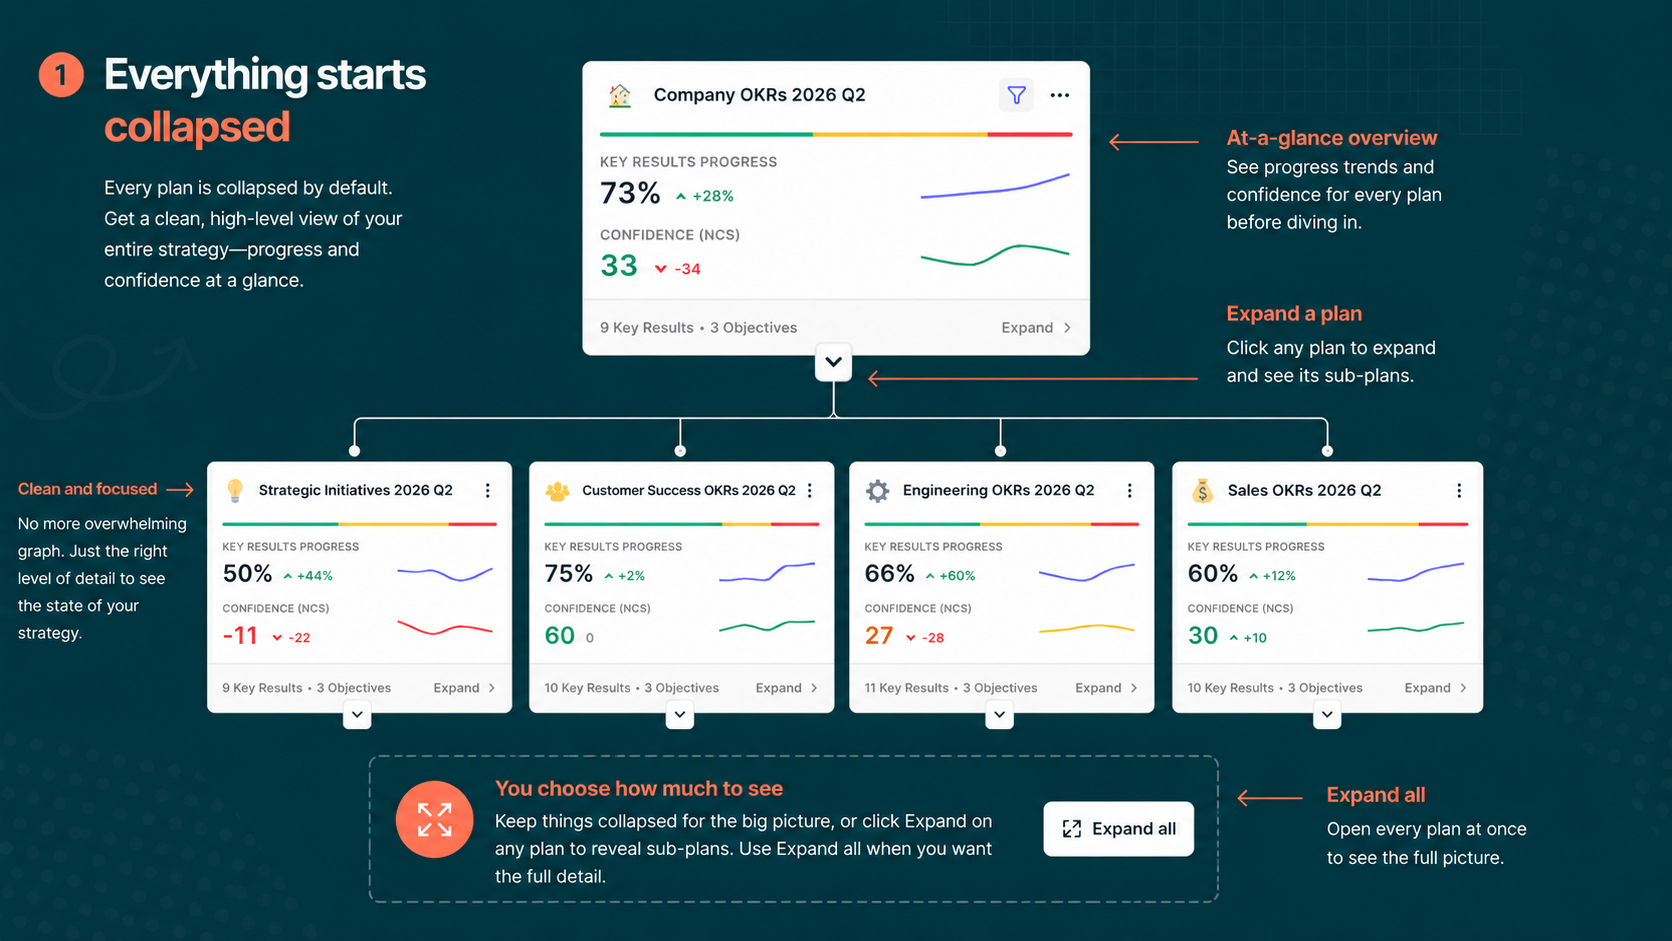
If you don't have the new view yet, you can open the new strategy map using the switch button in the workspace header. The first thing you'll notice is that every plan is collapsed by default.
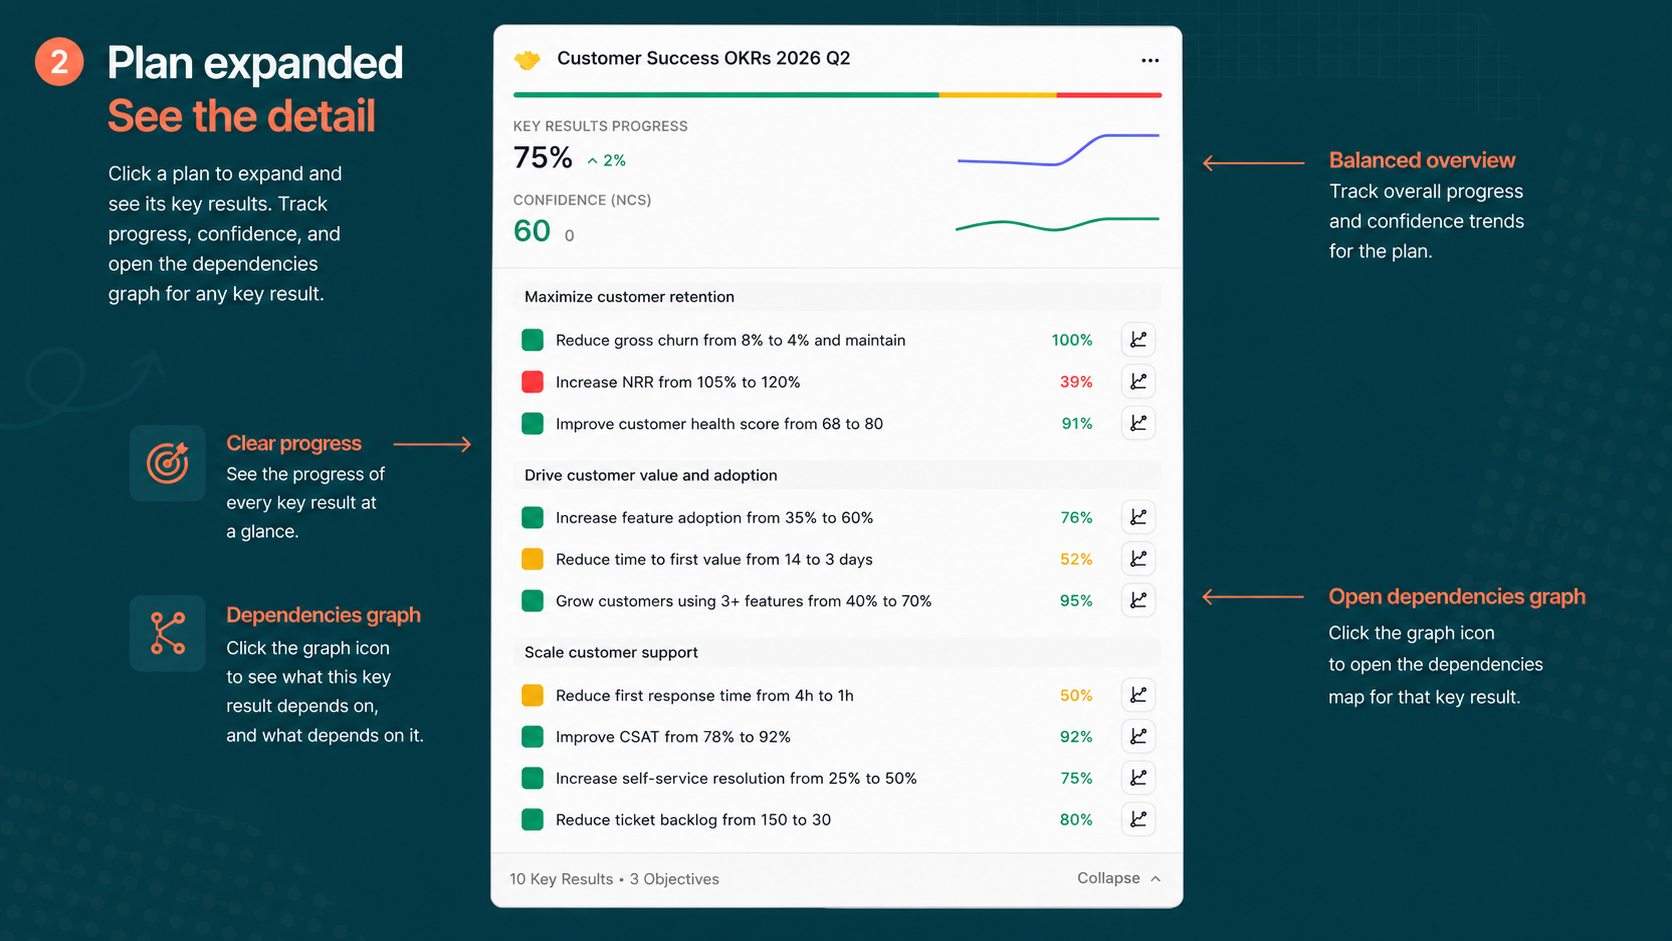
Instead of a sprawling graph, you get a clean line of plans, each with a progress chart showing week-by-week progress and confidence. You can read the state of your whole strategy at a glance before deciding where to look closer.
Click a plan and it expands to show the sub-plans underneath, so you can see how progress is distributed across teams without losing the overview. Want the detail? Click Expand on any plan to see its OKRs, or click Expand all to open everything at once. You choose how much you want on screen.
Filter to what matters
Even collapsed, a workspace with a lot of plans can stretch out. So we added a filter.
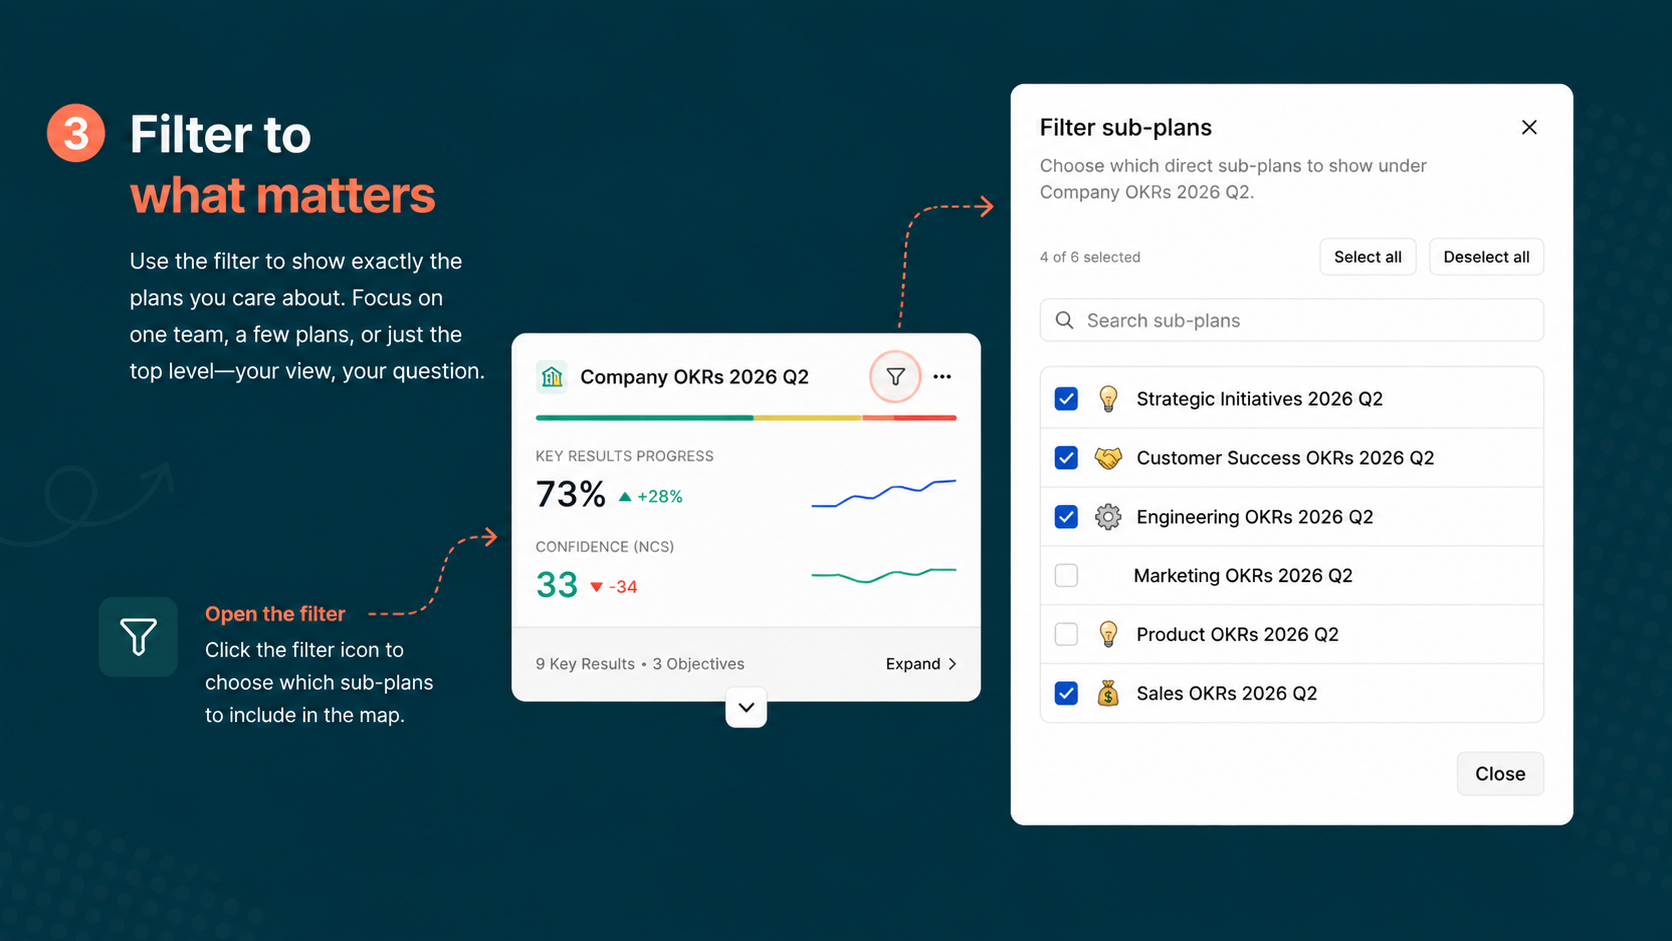
Open it and pick exactly which plans you want to see. Focus on the Product team and the rest drops away. The filter works at every level, including the top, so you can hide the annual goal and keep only Company OKRs if that's the view you need. What you're left with is a graph built around one question instead of all of them.
Switch the layout and share the view
The map runs vertically by default. If you'd rather see it horizontally, switch with one click, and bringing every plan back into view is just as quick.
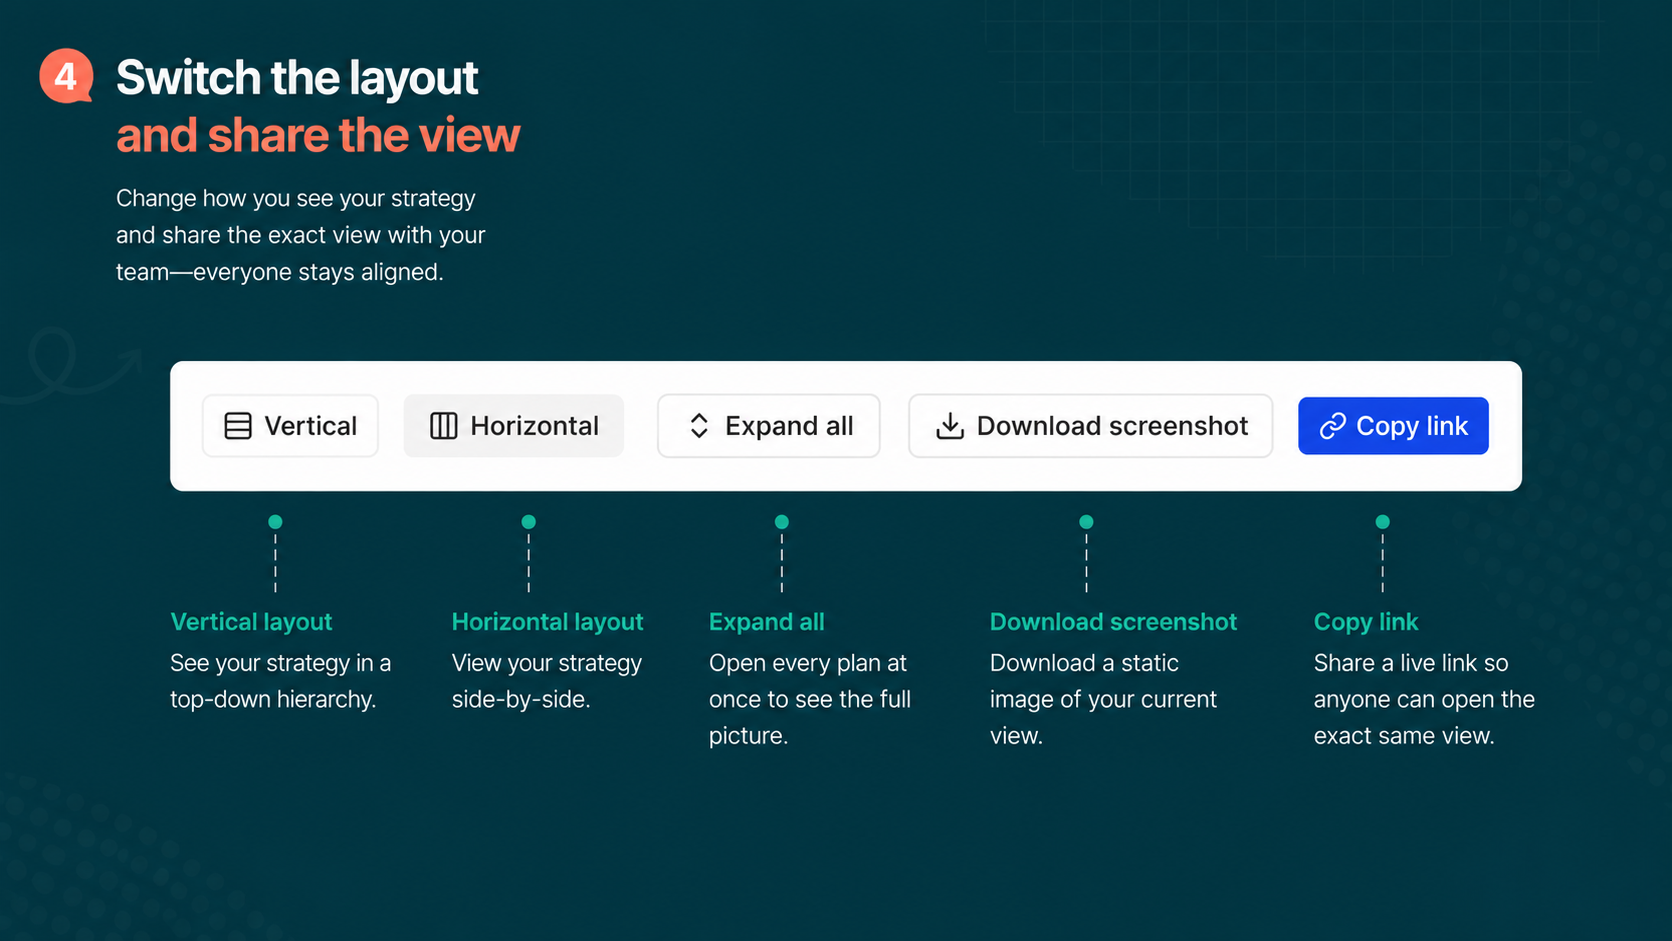
The bigger change is sharing. Copy the link to your current view and anyone you send it to opens the same thing: same plans, same filters, same layout. No instructions needed. That's useful for a report or an email when you want someone to review the exact status you're seeing, not a different version of it.
You can also click any item to pull up its progress chart, and download a screenshot of the current view if you want a static snapshot.
How to access the strategy map
- Go to your Tability workspace
- Click on the strategy map icon in the side nav
The dependencies map, rebuilt
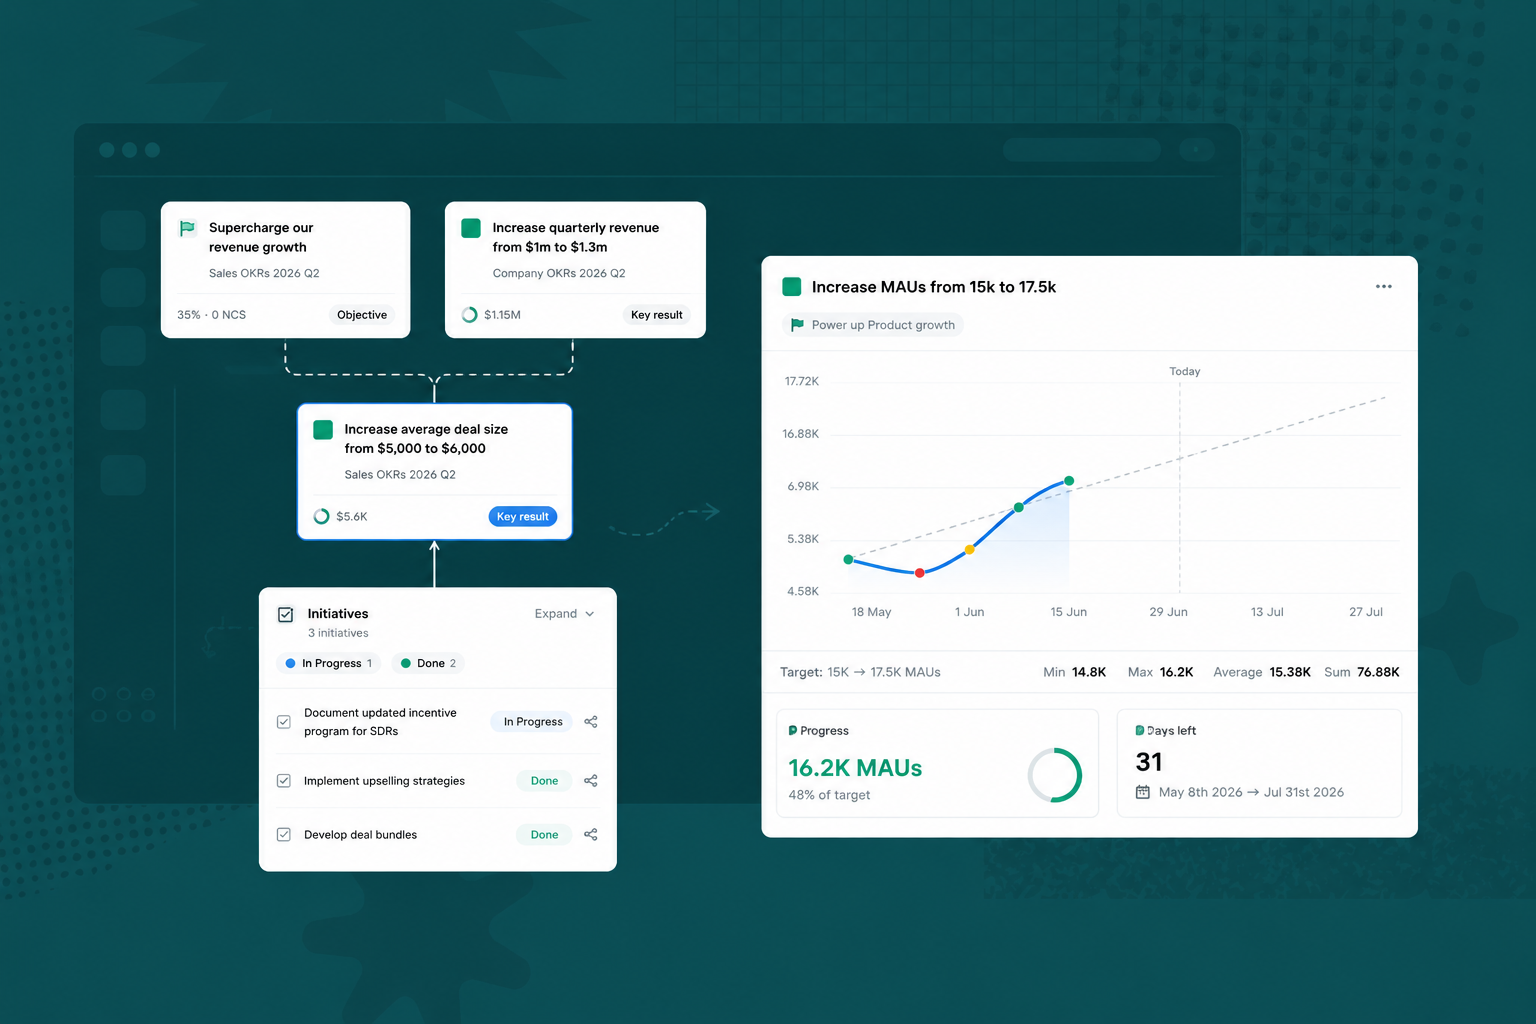
The strategy map answers "how is everything doing?" The dependencies map answers a harder question: "what does this goal actually depend on, and what's depending on it?"
We had a version of this already. In a plan, the option at the top was the cascading map, and it let you trace dependencies for each key result. It was useful, but it wasn't complete. It only showed key result to key result relationships. You couldn't see objectives, and initiatives weren't handled the way we wanted.
So we recreated the whole thing.
A more complete graph
Click Open dependencies map and you get a new graph with a much fuller picture. It shows the plan itself as part of the map, and it shows your objectives, not just key results.
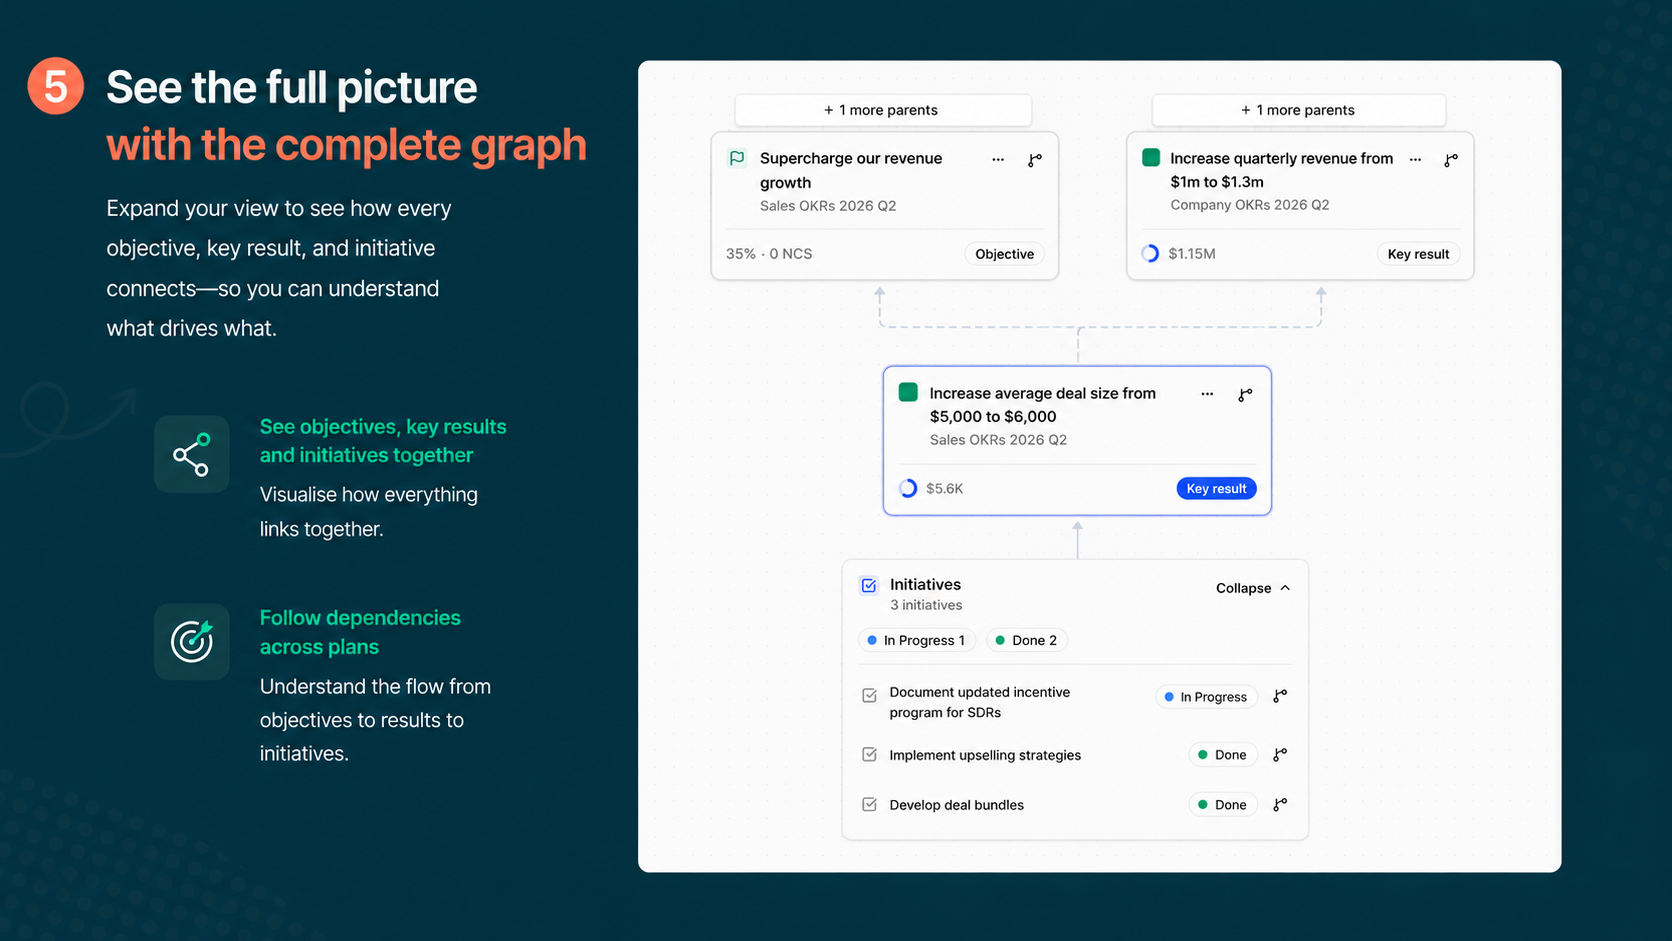
Highlight any item and the graph traces the dependency path between items, so you see the whole chain rather than just the things sitting next to each other.
Control how deep it goes
A complete graph can also be a busy one, so you control how much it shows.
You can increase the number of dependencies on screen, step through to reveal more, or set the graph to expand two, three, or four levels deep. The same controls apply to parent dependencies, the things sitting upstream of your goal. When it gets too dense, restore the view and you're back to exactly what you wanted to see.
Focus on a single goal
Instead of displaying everything, you can change the focus to one item.
Click the focus icon and pick a key result, say Increase product review rating. That key result becomes the centre of the map. From there you see its direct dependencies, with initiatives you can expand, and its indirect dependencies, including ones pulled in from other plans. It works the same way at the objective level and for whole plans.
This is the part that makes the difference. You can take a single goal and see the full network behind it, even when that network crosses plan boundaries. That's the view you want when you're trying to work out why a goal is stuck, or what you'd put at risk by changing it.
Open it from anywhere
You don't have to start from the map to use it.
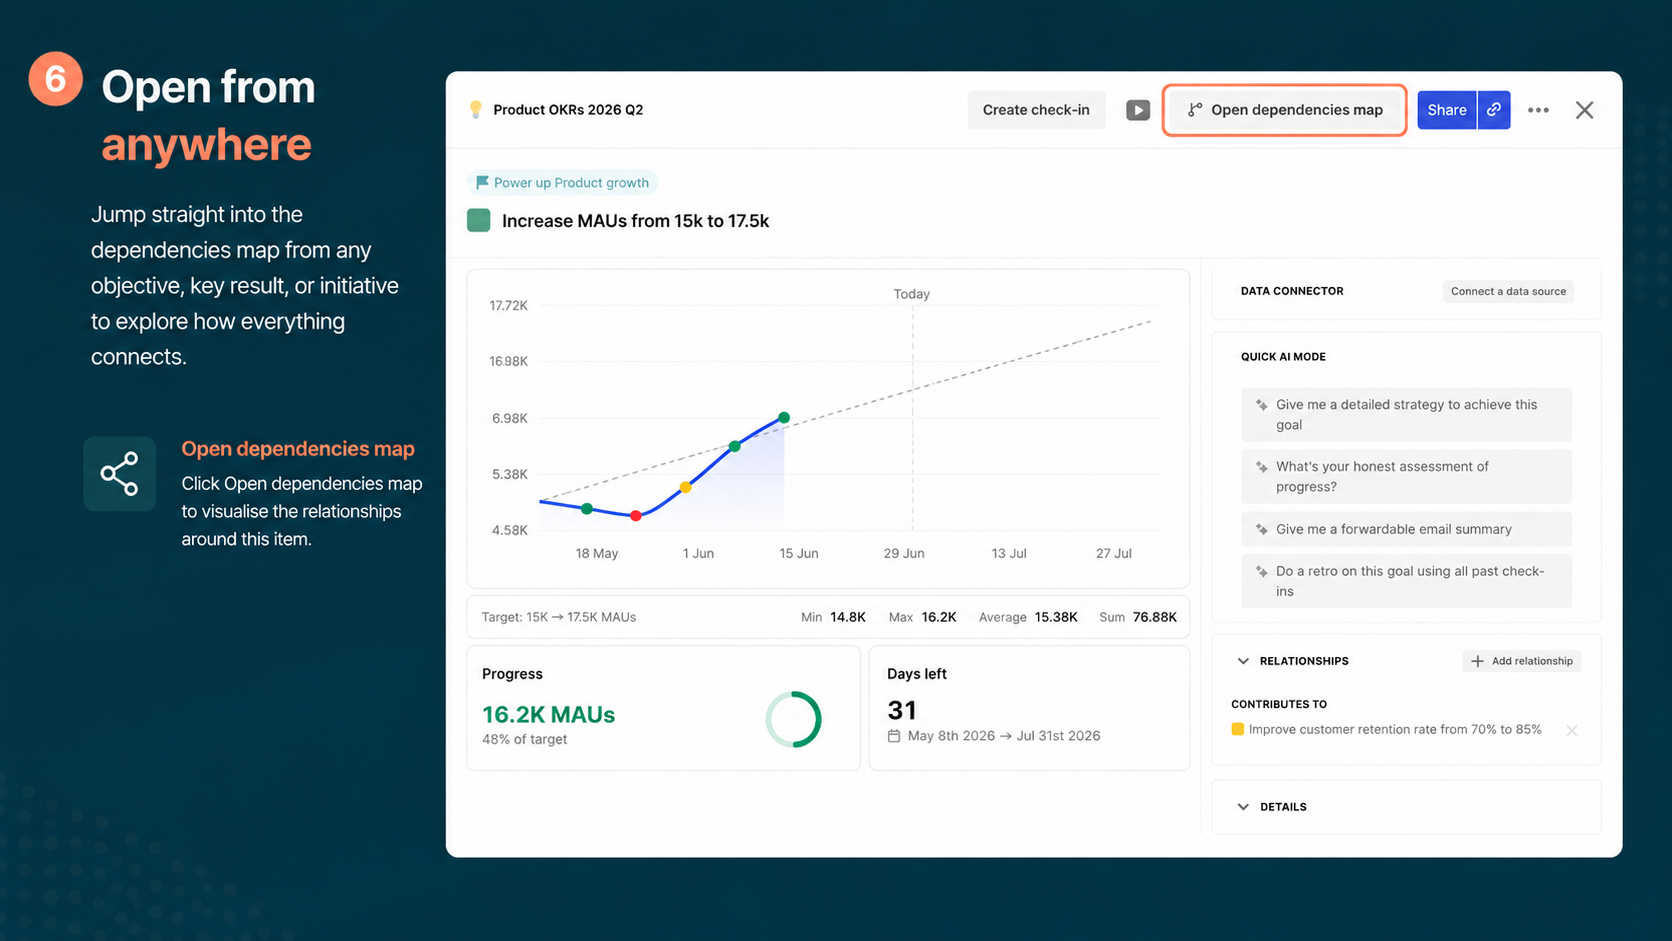
From any plan, select a goal and open the dependencies map straight from there. It opens focused on that goal. So if you're deep in your Salesforce plan and want to understand what one objective hangs on, you're one click away from the answer. And as with the strategy map, you can download a screenshot of the current view for a report or an update.
How to access the dependencies map
- Go to any objective, key result or initiave
- Open the details panel
- Click on Open dependencies map in the panel header
Both are live now
The two maps are built to work together. Use the strategy map to scan your whole workspace and find where attention is needed, then drop into the dependencies map to understand what a specific goal depends on and what it affects.
Both are available now -- if you don't already have a Tability account you can sign up for a free trial at https://www.tability.io
.png)

.jpg)