Would you track your projects in a spreadsheet? Your epics, your tasks, your team discussions, your progress?
Most likely not. We use tools like Jira, Trello, or Monday because they provide us with many answers out of the box. 1-click to know what's in progress, another to see a burn down chart, one more to change the status. You could do the same with Google Sheet and a few handcrafted formulas, but it's much easier and faster to get a good project management tool off the shelf.
The same applies to OKRs. We're in the early days of instrumenting strategy, and most teams still use spreadsheets to manage their quarterly goals. But, this comes at a cost. Just like with projects, there are some key questions that you should be able to answer quickly anytime during the quarter.
Question 1: Are we on track?
The answer to this question is not as easy as it looks. In fact, many teams today might be getting false positives due to the templates they're using. Let me explain.
OKRs are often presented as a table that only retains the latest progress update for each Key Result. It would be similar to looking at the chart below: you can see a data point, and you're good as long as you're above the progress line.

The issue here is that trends might tell us a different story. A week-by-week progress chart might not look so good.
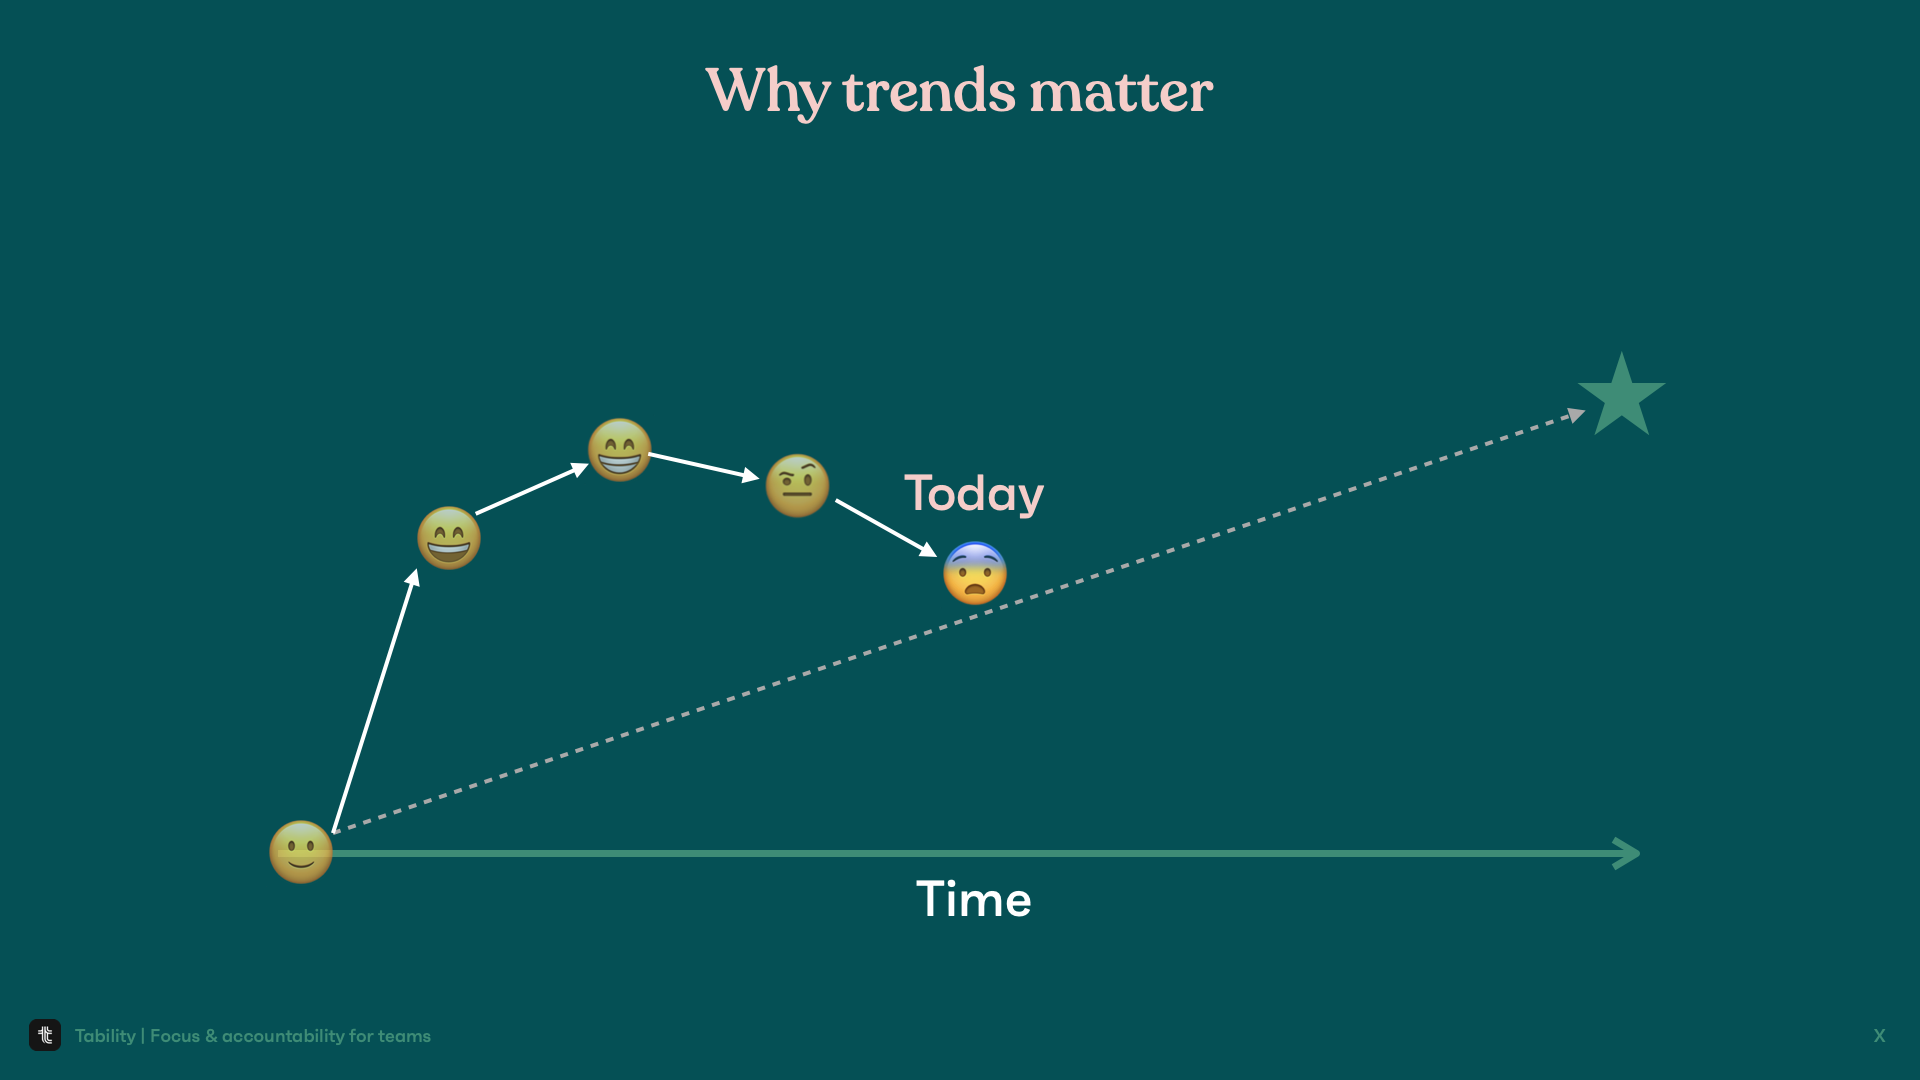
If you want to do OKRs right, you should strive to have the same kind of visibility for progress on your Key Results. Don't settle for a single data point – make sure you can see trends instead.
You can do that by adding a column for each passing week in your template and then having a progress chart for each of your KRs. But you can start to see the complexity increasing, and there are other questions to answer.
Question 2: What's currently at risk?
This is a follow-on from the previous point. It needs to be easy for you to identify the OKRs that are in trouble in your organization. That's all the more important if you are a manager with several teams to look after.
With spreadsheets you'll need to craft custom filters to build your own dashboard, or wait on someone else to write you a report. Worse, you might not even have a way to get that info and will have to go through each sheet and comb the OKRs to identify the troubled ones.
Wouldn't it be best to have a simple way to isolate OKRs that require your attention?
Question 3: What was our latest discussion?
OKRs are ultimately about collaboration. If all you do is looking at the progress of metrics, then you have a KPI dashboard – it's a great tool but it serves a different purpose. OKRs are about 2 things:
- Alignment at the start of the quarter: it's a simple way to create a shared North Star across your org.
- Focus during the quarter: it's a framework that puts outcomes at the center and helps teams adjust their priorities accordingly.
We often talk about the first benefit, but the second one is just as important. Progress on OKRs should be talked about every week, and it should help you have a healthy feedback cycle between the outputs produced by the team and the outcomes observed as a result.
Going back to spreadsheets, it's going to be almost impossible for you to keep track of weekly discussions and decisions. Knowledge will be lost, action items forgotten.
Question 4: what are we doing to improve?
The last point is about mapping OKRs back to activities and projects. Knowing early that a goal is getting off track is great, but the next steps are invariably to dig into the current roadmap to understand if we have the right plan to correct the situation.
This is difficult to do when your goals are in one place, and your projects in another. So it's best to use a platform like Tability that can easily show you the list of projects attached to a specific outcome.

Your strategy deserves the right kind of support
We need to stop treating execution on strategy as an afterthought. Project management tools are helping teams deliver outputs, and we now need new kinds of platforms to help us deliver outcomes with great success.
Tability is a platform built for that exact purpose. It lets you plan your OKRs as easily as you would do writing a doc, and then makes it simple to keep track of progress and answer all the questions that you might have during the quarter:
- Are we on track?
- What requires my attention?
- What's our latest discussion?
- What are we planning to achieve this KR?
You can answer all of those (and more!) in a couple of clicks. Let's stop spending hours handcrafting dashboards and start supporting our OKRs like a proper framework. Try it for free →
.png)

.jpg)