Plan, track, report. Rinse and repeat.
That is an oversimplified view of what goes into doing OKRs. In reality, the details of this is complicated and unique for every company. For the most part, these three aspects are a key part of the OKR process for any org.
Every quarter or year starts with planning sessions and setting goals for the next cycle. Then, you track your plan/goals by monitoring the numbers and completing tasks that help you progress. The third part is reporting, where you take that work and progress periodically and translate it to the people who need to know: your boss, your boss's boss, stakeholders, investors, and more. You have to send an investor status report, do all staff meetings, team and individual reviews.
Reporting and sharing is a significant part of the process and often a tedious job. It often involves a series of steps, such as:
- Data Collection: Gathering accurate and updated numbers to use in your reports.
- Data Analysis: Digesting the data and drawing meaningful conclusions.
- Presentation: Finding a way to transform raw data into something presentable and easy to understand
- Documentation: Compiling the presentation into various formats and adding it to your organization's knowledge base.
- Distribution: Sharing the information with the right people, which may involve sending emails or providing links to accessible documents.
The retrospective is a pivotal part of the OKR workflow. It allows you to digest and share your progress and reflect on your accomplishments and the alignment with your goals. It's a time to ask yourself:
- Are we hitting our goals?
- What have we accomplished?
- Are these still the goals we should be tracking?
While tracking goals is important and a challenge, one of the real powers of OKRs lies in taking that data and reflecting on it. This process of reporting and reflecting allows you to correct your course, seek continuous improvement, and celebrate your achievements. The data-driven insights gained during the retrospective can guide decision-making and steer your organization in the right direction.
The Art of OKR reporting
Reporting is not merely a formality; it's a strategic component of the OKR process. It serves as a source of numerous benefits that propel organizations toward their goals:
- Transparency and Accountability: Reporting fosters a culture of transparency, ensuring everyone understands what's happening and their role in the journey. This transparency builds trust and accountability.
- Informed Decision-Making: Effective reporting transforms raw data into actionable insights, empowering organizations to make informed decisions and refine their strategies.
- Better Prioritization: Reporting enables organizations to evaluate whether their priorities align with their objectives, facilitating more effective resource allocation.
- Continuous Improvement: Through reporting and reflection, organizations can identify areas for growth and innovation, fostering a culture of continuous improvement.
- Enhanced Communication: Clear and well-structured reports facilitate effective communication, reducing misunderstandings and keeping everyone on the same page.
- Alignment with Strategic Goals: Reporting ensures that organizations remain aligned with their strategic goals, guiding them toward long-term success.
- Celebrating Achievements: Reporting isn't just about identifying areas for improvement; it's also an opportunity to celebrate successes, boosting team morale and motivation.
Three ways to save time for your OKR reports
Reporting is a key part of the OKR process, but it's not always easy. Here are three easy ways to streamline your processes...
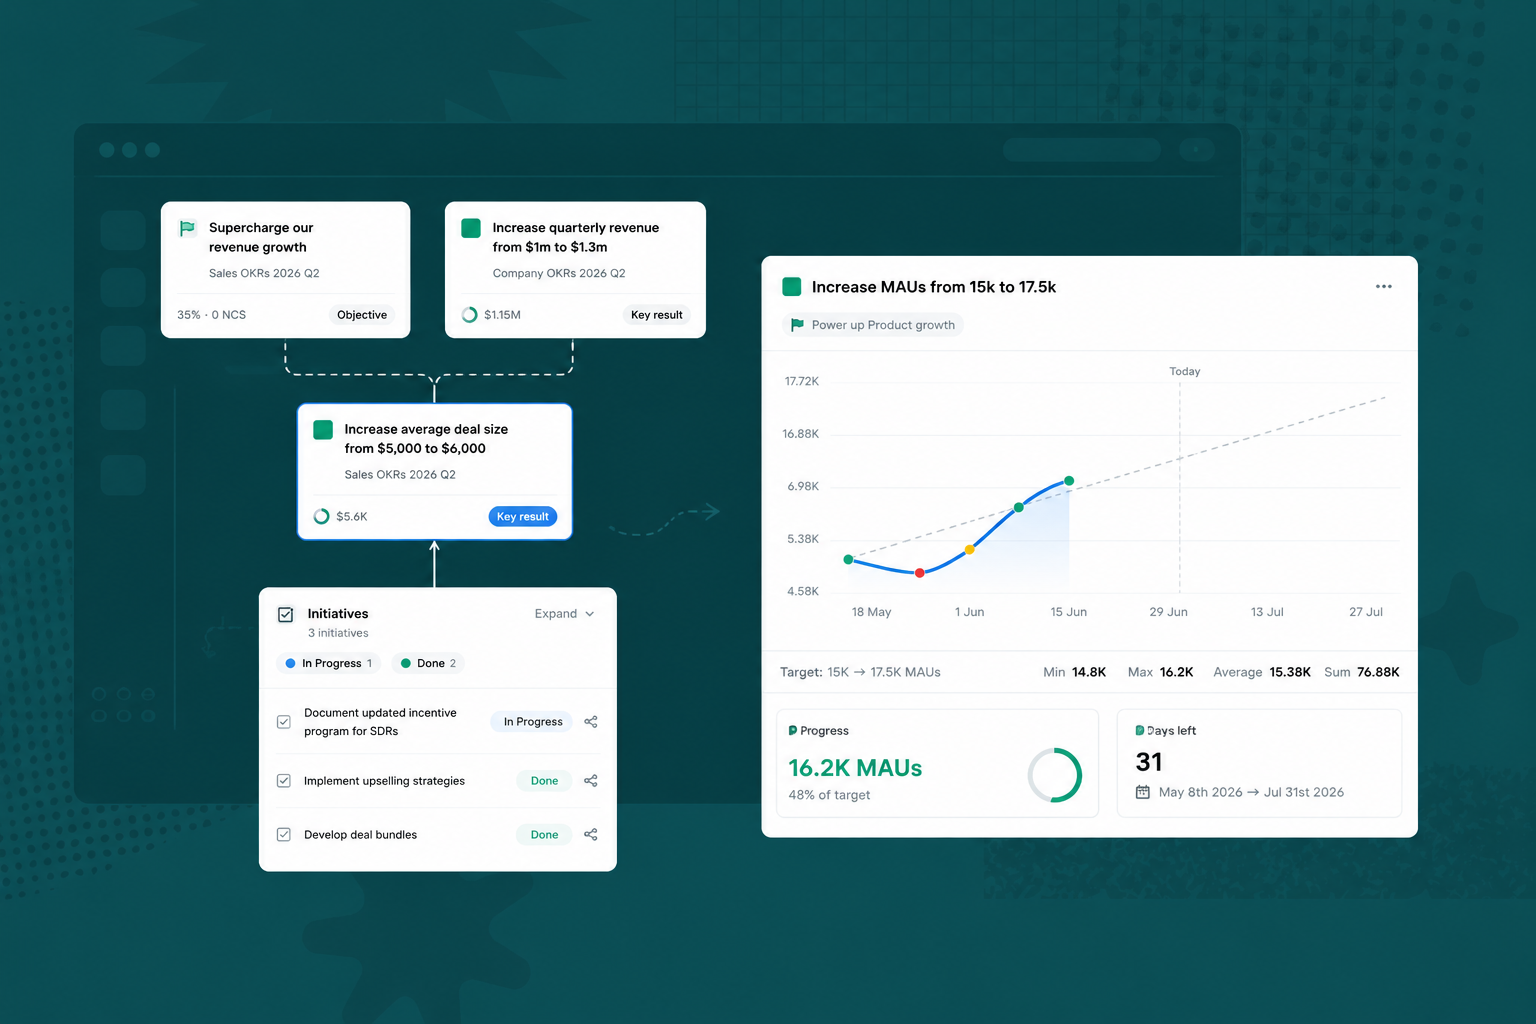
Weekly OKR Check-ins form
It's not a reporting function, but your weekly Check-ins force you to reflect on your progress on a week-to-week basis. While typically you wouldn't write a full report, having numbers, visual charts, and a written analysis gives you similar benefits to a full report.
.png)
Being tied to one goal or objective allows you to take a granular look at something and ensure that progress and priority are where they need to be. This is an important feedback loop that keeps you accountable for the priorities and decision making around a specific outcome.
Using a tool like Tability allows you to create those weekly check-ins, but also has many ways for you to share those updates. Download shareable charts and check-ins in Tability.
Once you've downloaded a chart, it works like any other image file — you can share it to Twitter or Linkedin or drop it into your Slack channel!
Building an OKR presentation in 1-click
OKRs are great for building that transparency around goals in your org. It's important to ensure that you're sharing your progress and your wins and that people know, as well as you, what your team is working on.
.png)
Usually, you want to pair your OKR tracking with a frequent team meeting (weekly or bi-weekly) where you can discuss these questions with your team.
A key to making your team meetings successful is having visuals. Building a presentation can be a chore, but having slide-by-slide charts and visuals to accompany your OKR review makes for a much more meaningful and insightful conversation. Seeing a chart or progression of numbers vs just hearing a verbal update on a project can enrich the conversation and help your teammates digest your updates more easily.
If you have a good template for your keynote or PowerPoint, it can speed up building these presentations from scratch. Alternatively, your goal-tracking tool may have a way to display progress in a presentation mode.
Send OKR reports and retrospectives
Whether quarterly, monthly, or annual, there will be times periodically when stakeholders and investors need to hear about how your business is doing. You typically will be required to send out a monthly (or quarterly) investor update or do a report for your company. This report is usually an email, PDF, or Docs page that goes through all the highlights and challenges of the last month or quarter.
.png)
Like all other reports, it takes some effort to gather all that data, write your thoughts out, and send it all out to the parties involved. It takes a lot of work to get into the flow of how to do these reports correctly and efficiently. Regardless of how good you are at it, it's not usually part of your usual workload and can be a chore to switch to "reporting mode." You want to get back to the things you were working on ASAP.
Conclusion: Take care in your reporting
It's often overlooked as just a tedious part of the process. Your boss wants a report, and you get them a report. But reporting isn't just a formality; it's the heartbeat of an organization's efforts, ensuring everyone stays informed, aligned, and motivated. Embrace the art of reporting, and watch your team rise to new heights, powered by transparency, accountability, and the commitment to achieving its objectives. Remember that as you're going through the process (and the chore of it), there is a wealth of knowledge there that you are putting together, reflecting on, and informing the rest of the company.
(Not convinced? See how Tability can save you 80% of your reporting time)
You can try Tability for free to see how these report can increase transparency inside of your organisation.
.png)
.jpg)